Nº 580 of 605
Portfolio dashboard
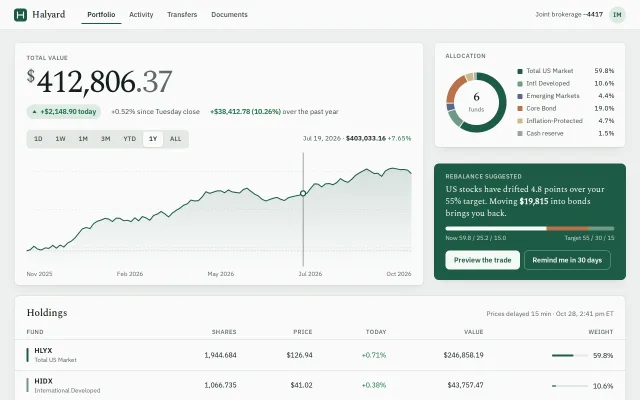
A calm investing dashboard: a 64px serif total, range tabs over a scrubbable value chart, an allocation ring, a rebalance card and a holdings table.
Preview
Use it
Free to use · credit appreciated1 Once, in your project · Node 22.20+
npx skills add SusanAcharya/Design-Lounge 2 Then ask
Using the Design Lounge skill, build "Portfolio dashboard" (piece fintech-portfolio-dashboard) in my stack. Match its brief; restyle it onto my product's theme.
No skill? Paste the brief instead. It carries the numbers, tokens and behaviour.
<!-- Design Lounge Nº 580 · "Portfolio dashboard" · www.designlounge.live -->

# Portfolio dashboard

> **Build brief for a coding agent.** Rebuild this piece in the reader's stack. If they haven't said which stack, ask once, then default to semantic HTML + CSS + a little vanilla JS. Match the numbers below; don't "improve" them.

## What it is

The home screen of a brokerage account at an invented fund house, Halyard. One glance answers three questions in order: what is it worth ($412,806.37 set in a 64px Spectral serif), how did it get here (a value chart with range tabs you can scrub point by point), and is it still shaped the way I asked (an allocation ring and a deep-pine rebalance card that names the exact dollar move). Below sits a holdings table with weight bars. The mood is a private bank statement, not a trading terminal: sage-grey ground, one pine accent, no red unless something actually fell. The detail worth copying is the rebalance card's split bar, which previews the after-trade mix in place when you press "Preview the trade".

## Reference behaviour

1. Initial state: range tab **1Y** is selected; the chart draws its line left to right over 700ms; the scrub cursor already sits on Jul 19, 2026 and the readout reads `Jul 19, 2026 · $403,033.16 +7.65%`, so the first frame shows the scrub feature.
2. Under the total, a pale pine chip reads `+$2,148.90 today` with an up triangle, then `+0.52% since Tuesday close`, then the range delta `+$38,412.78 (10.26%) over the past year` with the figure in `--up` 600.
3. Moving the pointer across the chart snaps a 1px vertical rule and a 10px ringed dot to the nearest data point; the readout (right of the tabs) updates to `<date> · <value> <change since range start>`. Leaving the chart hides the cursor (160ms fade) and the readout returns to `Hover or use the arrow keys to read a point`.
4. Clicking a range tab (1D, 1W, 1M, 3M, YTD, 1Y, ALL) regenerates the series, redraws the line with the 700ms draw, updates the five x-axis labels and the range-delta sentence ("over today", "over the past week", "this year", "all time, since Mar 2019"). All series end at the current total.
5. A dashed baseline is drawn at the range's starting value so up/down for the range reads at a glance.
6. Hovering or focusing an allocation legend row dims every other ring segment to 28% opacity and thickens the matching segment from 16px to 20px stroke.
7. "Preview the trade" toggles `aria-pressed`. On: the split bar animates (320ms) from 59.8 / 25.2 / 15.0 to 55 / 30 / 15, the left caption reads `After 55.0 / 30.0 / 15.0`, and the button reads "Back to current mix". Off reverses.
8. Holdings rows tint to `#F1F4F2` on hover. Day change is green for positive, rust for negative, ink for zero.

## Structure

```
1280 × 800
┌──────────────────────────────────────────────────────────────────────────────┐
│ [H] Halyard   Portfolio  Activity  Transfers  Documents   Joint ··4417  (IM) │ 60
├──────────────────────────────────────────────────────────────────────────────┤
│ pad 28                                                                        │
│ ┌ perf card (1fr) ───────────────────────────────┐ ┌ alloc card 384 ────────┐ │
│ │ TOTAL VALUE                                     │ │ ALLOCATION             │ │
│ │ $412,806.37   (64px serif, cents in --ink-3)    │ │ (ring 124) legend × 6  │ │
│ │ [+$2,148.90 today] +0.52% …  +$38,412 over 1Y   │ └────────────────────────┘ │
│ │ [1D 1W 1M 3M YTD 1Y ALL]        readout ▸       │ ┌ rebalance card ────────┐ │
│ │ chart 228 tall, area fill, dashed baseline      │ │ REBALANCE SUGGESTED    │ │
│ │ x-axis: 5 labels ("Nov 2025" for 1Y/ALL, "Oct 21" for 1W to YTD, "9:30 AM" for 1D)                                │ │ serif sentence 17px    │ │
│ └─────────────────────────────────────────────────┘ │ split bar 8px, keys    │ │
│                                                     │ [Preview] [Remind me]  │ │
│                                                     └────────────────────────┘ │
│ ┌ holdings card (full width) ───────────────────────────────────────────────┐ │

… 179 more lines. Copy or download for the full brief. Loading the source…Brief
219 linesBuild brief for a coding agent. Rebuild this piece in the reader’s stack. If they haven’t said which stack, ask once, then default to semantic HTML + CSS + a little vanilla JS. Match the numbers below; don’t “improve” them.
What it is
The home screen of a brokerage account at an invented fund house, Halyard. One glance answers three questions in order: what is it worth ($412,806.37 set in a 64px Spectral serif), how did it get here (a value chart with range tabs you can scrub point by point), and is it still shaped the way I asked (an allocation ring and a deep-pine rebalance card that names the exact dollar move). Below sits a holdings table with weight bars. The mood is a private bank statement, not a trading terminal: sage-grey ground, one pine accent, no red unless something actually fell. The detail worth copying is the rebalance card’s split bar, which previews the after-trade mix in place when you press “Preview the trade”.
Reference behaviour
- Initial state: range tab 1Y is selected; the chart draws its line left to right over 700ms; the scrub cursor already sits on Jul 19, 2026 and the readout reads
Jul 19, 2026 · $403,033.16 +7.65%, so the first frame shows the scrub feature. - Under the total, a pale pine chip reads
+$2,148.90 todaywith an up triangle, then+0.52% since Tuesday close, then the range delta+$38,412.78 (10.26%) over the past yearwith the figure in--up600. - Moving the pointer across the chart snaps a 1px vertical rule and a 10px ringed dot to the nearest data point; the readout (right of the tabs) updates to
<date> · <value> <change since range start>. Leaving the chart hides the cursor (160ms fade) and the readout returns toHover or use the arrow keys to read a point. - Clicking a range tab (1D, 1W, 1M, 3M, YTD, 1Y, ALL) regenerates the series, redraws the line with the 700ms draw, updates the five x-axis labels and the range-delta sentence (“over today”, “over the past week”, “this year”, “all time, since Mar 2019”). All series end at the current total.
- A dashed baseline is drawn at the range’s starting value so up/down for the range reads at a glance.
- Hovering or focusing an allocation legend row dims every other ring segment to 28% opacity and thickens the matching segment from 16px to 20px stroke.
- “Preview the trade” toggles
aria-pressed. On: the split bar animates (320ms) from 59.8 / 25.2 / 15.0 to 55 / 30 / 15, the left caption readsAfter 55.0 / 30.0 / 15.0, and the button reads “Back to current mix”. Off reverses. - Holdings rows tint to
#F1F4F2on hover. Day change is green for positive, rust for negative, ink for zero.
Structure
1280 × 800
┌──────────────────────────────────────────────────────────────────────────────┐
│ [H] Halyard   Portfolio  Activity  Transfers  Documents   Joint ··4417  (IM) │ 60
├──────────────────────────────────────────────────────────────────────────────┤
│ pad 28                                                                        │
│ ┌ perf card (1fr) ───────────────────────────────┐ ┌ alloc card 384 ────────┐ │
│ │ TOTAL VALUE                                     │ │ ALLOCATION             │ │
│ │ $412,806.37   (64px serif, cents in --ink-3)    │ │ (ring 124) legend × 6  │ │
│ │ [+$2,148.90 today] +0.52% …  +$38,412 over 1Y   │ └────────────────────────┘ │
│ │ [1D 1W 1M 3M YTD 1Y ALL]        readout ▸       │ ┌ rebalance card ────────┐ │
│ │ chart 228 tall, area fill, dashed baseline      │ │ REBALANCE SUGGESTED    │ │
│ │ x-axis: 5 labels ("Nov 2025" for 1Y/ALL, "Oct 21" for 1W to YTD, "9:30 AM" for 1D)                                │ │ serif sentence 17px    │ │
│ └─────────────────────────────────────────────────┘ │ split bar 8px, keys    │ │
│                                                     │ [Preview] [Remind me]  │ │
│                                                     └────────────────────────┘ │
│ ┌ holdings card (full width) ───────────────────────────────────────────────┐ │
│ │ Holdings                              Prices delayed 15 min · Oct 28 …    │ │
│ │ FUND        SHARES     PRICE     TODAY      VALUE        WEIGHT ▬▬▬ 59.8% │ │
│ └───────────────────────────────────────────────────────────────────────────┘ │
└──────────────────────────────────────────────────────────────────────────────┘
grid: minmax(0,1fr) 384px, gap 20, perf spans 2 rows, align-items start
<header class="top">: brand (26px rounded-square mark + 19px Spectral wordmark),<nav aria-label="Primary">list, account label and 34px initials avatar.<main>grid with four<section class="card">regions, eacharia-labelledbyits label.- Perf:
<p class="lab">,.total(currency<span>, integer, cents<span>),.deltas,.chartbarholdingrole="tablist"and anaria-live="polite"readout,.chart(tabindex="0",role="img") with one stretched SVG (viewBox 760×240,preserveAspectRatio="none") and one overlay SVG for the dot so it stays round. - Allocation:
.ring(SVG of six<circle>segments, rotated −90°) with a centred count,<ul class="legend">rows focusable. - Rebalance: label,
<p>sentence,.splitbar of three spans,.keyscaptions, two<button>s. - Holdings:
<table>with<th scope="col">; first cell is a 4×28px colour tab + ticker + fund name.
Tokens
:root {
  /* ground and surfaces: cool sage-grey */
  --bg: #EDF0EE;          /* page */
  --surface: #FAFBFA;     /* cards, top bar */
  --sunk: #E3E8E5;        /* tab track, empty weight bar, nav hover */
  --line: #D5DCD8;        /* hairlines, dashed grid */
  --line-2: #BCC7C1;      /* baseline dash */
  --ink: #13201B;         /* primary text */
  --ink-2: #46534D;       /* secondary text */
  --ink-3: #5E6B65;       /* labels, axis, cents */

  /* the one accent: pine */
  --accent: #1E5B46;      /* chart line, active nav underline, rebalance card */
  --accent-wash: #DCEAE2; /* today chip, avatar */
  --on-accent: #F4F8F5;   /* text and primary button on pine */
  --accent-deep: #174A39; /* split-bar track, ghost hover */
  --on-accent-2: #C9DDD2; /* captions on pine (6.0:1) */

  /* direction */
  --up: #1B6E45;
  --down: #A8402B;

  /* allocation (data only) */
  --a1: #1E5B46; --a2: #6F9A85; --a3: #B9714A;
  --a4: #56698A; --a5: #CDBA8E; --a6: #9AA6A0;

  /* type */
  --serif: "Spectral", Georgia, serif;
  --sans: "IBM Plex Sans", system-ui, sans-serif;
  --fs-total: clamp(40px, 6vw, 64px);
  --fs-body: 14px;
  --fs-small: 13px;
  --fs-label: 12px;

  /* space and shape */
  --pad: 28px;            /* 16px under 640 */
  --gap: 20px;
  --col-right: 384px;
  --r: 10px;              /* cards */
  --r-sm: 6px;            /* tabs, nav */
  --shadow: 0 1px 0 rgba(19,32,27,.04), 0 8px 24px -12px rgba(19,32,27,.14);

  /* motion */
  --t-fast: 160ms;
  --t-layout: 320ms;
  --t-draw: 700ms;
  --ease: cubic-bezier(.2, .7, .2, 1);
  --ease-out: cubic-bezier(.16, 1, .3, 1);
}
Typography
| Role | Family | Size | Weight | Line-height | Tracking | Case |
|---|---|---|---|---|---|---|
| Total value | Spectral | 64px | 400 | 1 | −0.025em | numerals |
| Currency sign | Spectral | 0.55em, raised 0.62em | 400 | 1 | 0 | — |
| Cents | Spectral | 64px | 400 | 1 | −0.025em | --ink-3 |
| Card heading | Spectral | 20px | 500 | 1.2 | 0 | sentence |
| Rebalance sentence | Spectral | 17px | 400 | 1.4 | 0 | sentence |
| Wordmark | Spectral | 19px | 500 | 1 | −0.01em | sentence |
| Body, table cells | IBM Plex Sans | 14px | 400 | 1.45 | 0 | sentence |
Labels, th | IBM Plex Sans | 12px | 500 | 1.2 | +0.06em | UPPERCASE |
| Tabs, readout | IBM Plex Sans | 13px | 500 | 1.45 | 0 | — |
| Ticker | IBM Plex Sans | 14px | 600 | 1.3 | +0.02em | UPPERCASE |
Every figure on the page uses font-variant-numeric: tabular-nums, set on body.
Motion
| Element | Trigger | Property | From → To | Duration | Easing |
|---|---|---|---|---|---|
| Chart line | load, tab change | stroke-dashoffset | 3000 → 0 | 700ms | --ease-out |
| Scrub rule+dot | pointer enters/leaves | opacity | 0 ↔ 1 | 160ms | --ease |
| Scrub position | pointermove | x | snaps to nearest point | 0 | none |
| Ring segment | legend hover/focus | stroke-width, opacity | 16 → 20px, others 1 → .28 | 160ms | --ease |
| Split bar | preview toggle | width of 3 spans | 59.8/25.2/15 ↔ 55/30/15 | 320ms | --ease |
| Buttons | hover | background | tone step | 160ms | --ease |
Reduced motion: no line draw (it appears complete), every transition 1ms. Scrubbing still works.
States
- Nav current:
aria-current="page", ink text, 2px pine underline asinset 0 -2px 0box-shadow. Hover on others:--sunkfill. - Tab selected: white
--surfacepill with0 1px 2px rgba(19,32,27,.12)on the--sunktrack; others--ink-2, hover--ink. - Chart idle: cursor hidden, readout shows the hint. Scrubbing: rule, dot, readout with change coloured
--up/--down. - Legend focus: same as hover (segment highlight).
- Preview on:
aria-pressed="true", label swaps, bar and caption update. - Focus-visible: 2px pine outline, 2px offset, 4px radius; on the pine card the outline turns
--on-accent. - Empty (no holdings): replace ring with a 16px
--sunkcircle and the sentence “Nothing invested yet”; hide the rebalance card.
Accessibility
- Range tabs:
role="tablist"ofrole="tab"buttons witharia-selected; roving tabindex; Left/Right arrows move and select. - Chart:
tabindex="0",role="img",aria-labelthat names the arrow keys. Left/Right step one point, Home/End jump to ends; the readout isaria-live="polite"so each step is announced. Blur hides the cursor. - The dot lives in an overlay SVG so it stays a true circle while the line SVG stretches.
- Table uses
<th scope="col">; tickers and names stay text, not images. - Contrast:
--ink-3on--surfaceis 5.6:1;--on-accent-2on pine is 6.0:1;--upon--accent-wash5.1:1. - Buttons are 38px tall on web; avatar has an
aria-labelwith the account holders’ names.
Responsive rules
- ≥ 1280: as specified, content max 1280.
- 1024–1279: same grid, the right column stays 384px, perf column narrows.
- < 1024: one column; perf card first, then allocation, rebalance, holdings. Primary nav links hide (move them to a menu in production).
- < 640: page padding 16px, account label hides, the tab row becomes full-width with seven equal tabs, the readout drops under the tabs, chart 200px tall, ring 112px, Shares, Price and Weight columns hide (weight is in the ring above), fund names may wrap, the holdings header stacks, and the two rebalance buttons stack full width at 44px. Nothing scrolls sideways at 390.
Acceptance checklist
Always
- The total is the largest type on the page and its cents are a lighter ink.
- All amounts use tabular figures; currency and digits share one family.
- Range tabs are a real tablist with arrow-key movement and one selected tab.
- The chart snaps to the nearest point under the pointer and can be read with arrow keys; the readout is a polite live region.
- A dashed baseline marks the range’s starting value.
- Hovering or focusing a legend row isolates its ring segment.
- Only one primary action sits on the screen (the preview button on the pine card).
- At 390 wide nothing scrolls sideways and the table drops to three columns (Fund, Today, Value).
- Reduced motion removes the line draw and leaves scrubbing intact.
This demo
- Total reads
$412,806.37; today chip reads+$2,148.90 today. - 1Y is selected on load with the cursor on Jul 19, 2026.
- Six Halyard funds: HLYX, HIDX, HEMX, HBND, HTIP, HCSH, weights 59.8 / 10.6 / 4.4 / 19.0 / 4.7 / 1.5.
- Rebalance sentence names 4.8 points, a 55% target and $19,815; preview moves the bar to 55 / 30 / 15.
Implementation notes
Stretch the line, not the dot. Draw the path in a 760×240 viewBox with preserveAspectRatio="none" and vector-effect: non-scaling-stroke, and place the dot in a second, unscaled SVG using pixel coordinates:
function show(i) {
  idx = Math.max(0, Math.min(S.length - 1, i));
  const r = chart.getBoundingClientRect();
  vline.setAttribute('x1', X[idx]); vline.setAttribute('x2', X[idx]);
  dot.setAttribute('cx', X[idx] / 760 * r.width);
  dot.setAttribute('cy', Y[idx] / 240 * r.height);
  readout.innerHTML = `${label(idx)} · <b>$${fmt(S[idx])}</b>`;
}
chart.addEventListener('pointermove', e => {
  const r = chart.getBoundingClientRect();
  show(Math.round((e.clientX - r.left) / r.width * (S.length - 1)));
});
Every range must land on today’s total. Build the series backwards from the current value so the last point always equals the headline, then scale so the first point equals the range’s real starting value:
const v = [TOTAL];
for (let i = 1; i < n; i++) v.unshift(v[0] / (1 + step + noise()));
const f = TOTAL / (1 + growth) / v[0];
return v.map((x, i) => x * (f + (1 - f) * i / (n - 1)));
Ring segments as dashes. Each segment is a full circle with stroke-dasharray: <share × C − 2> <C> and a negative running stroke-dashoffset; the 2px subtraction makes the hairline gaps. Rotate the SVG −90° so the first segment starts at 12 o’clock.
Common mistakes: letting the chart’s dot stretch into an ellipse; a red/green palette on the allocation (it is data, not direction); restarting the draw animation without forcing a reflow (void el.offsetWidth), so it only plays once.
Details
- Palette
- Type
- Spectral · IBM Plex Sans
- Motion
- Subtle motion
- Build
- One session
- Tags
Similar
Fintech home
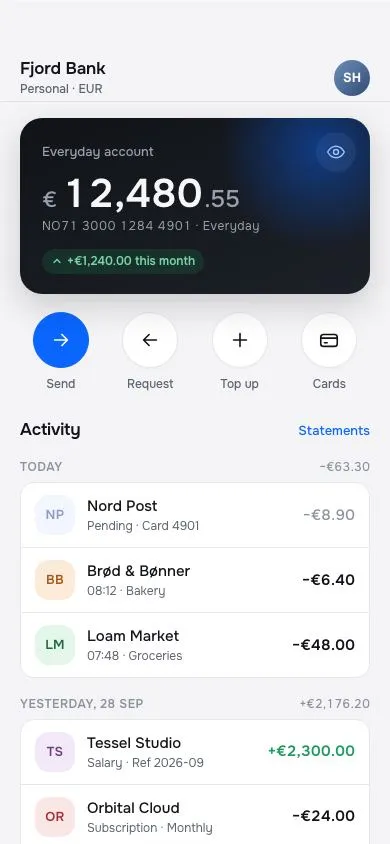
A banking home screen: dark balance card with a 40px tabular amount and a blur-to-hide toggle, four circular quick actions, day-grouped transactions with initial avatars, under a glass top bar.
Light fintech landing with tilting card
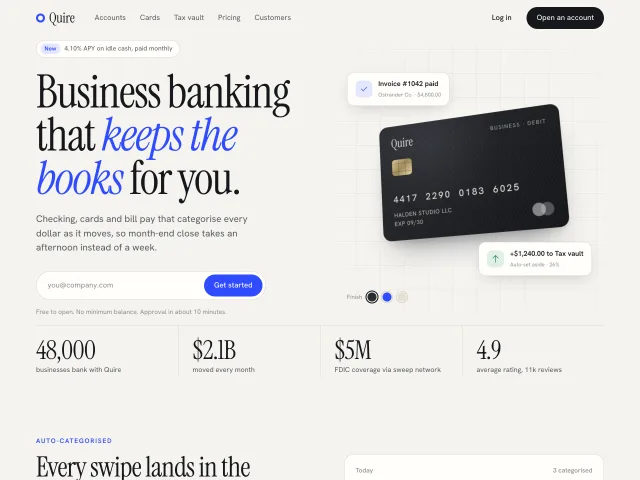
A warm-paper business banking landing page: serif headline, a CSS debit card that tilts toward the pointer with a moving glare, trust stats, feature rows and a cobalt CTA.
Analytics dashboard overview
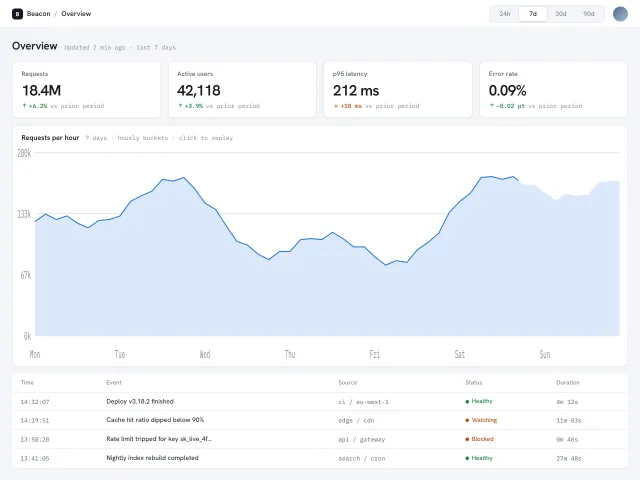
Light analytics overview: four KPI tiles, a single-series area chart drawn as inline SVG with an animated stroke, a crosshair tooltip, a recent-events table and a sliding date-range segmented control.
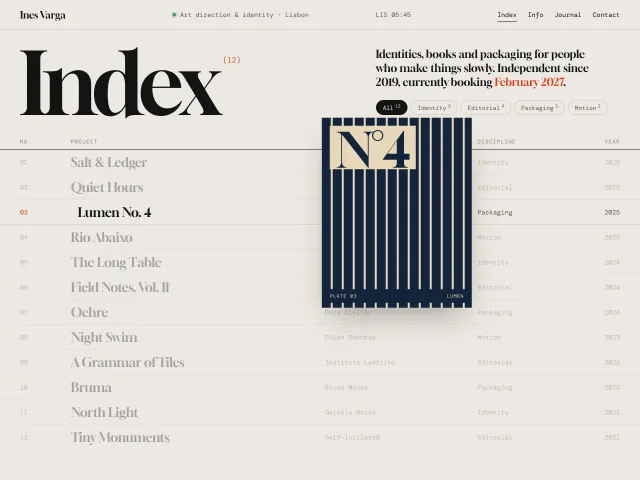
Portfolio index with hover preview
An art director's project index: a 12-column table of work where hovering a row floats an art-directed plate that trails the cursor with lag and tilt.
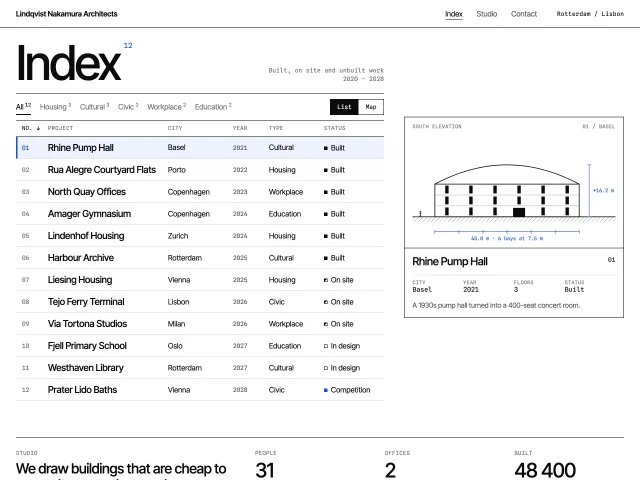
Architecture studio index
A Swiss studio index: sortable, filterable project table whose selected row drives a true-scale SVG elevation that slides to follow it, plus a map view.
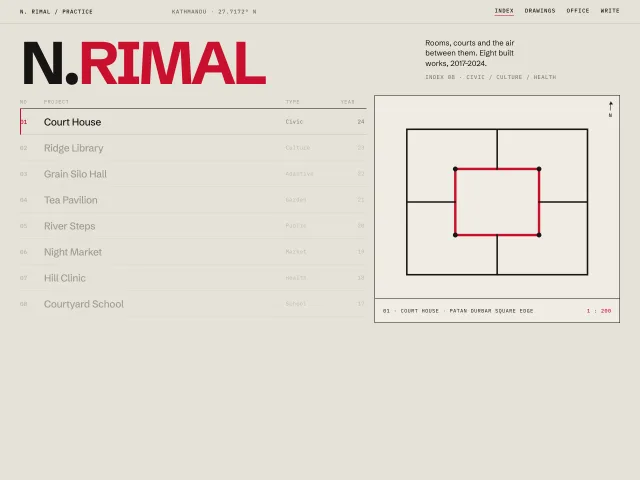
Architect index with plan drawings
A Swiss architect index: 120px wordmark, an 8-row 12-column project list, and a sticky right panel that crossfades a geometric plan on hover.