Nº 518 of 520
Scrub a firing curve
A 90 minute kiln curve. Drag or press an arrow key. The big number is the degree at that minute.
Preview
Use it
Free to use · credit appreciated1 Once, in your project
npx skills add SusanAcharya/Design-Lounge 2 Then ask
Using the Design Lounge skill, build "Scrub a firing curve" (piece chart-scrub-readout) in my stack. Match its brief; restyle it onto my product's theme.
No skill? Paste the brief instead. It carries the numbers, tokens and behaviour.
<!-- Design Lounge Nº 518 · "Scrub a firing curve" · www.designlounge.live -->

# Scrub a firing curve

> **Build brief for a coding agent.** Rebuild this piece in the reader's stack. If they haven't said which stack, ask once, then default to semantic HTML + CSS + a little vanilla JS. Match the numbers below; don't "improve" them.

## What it is

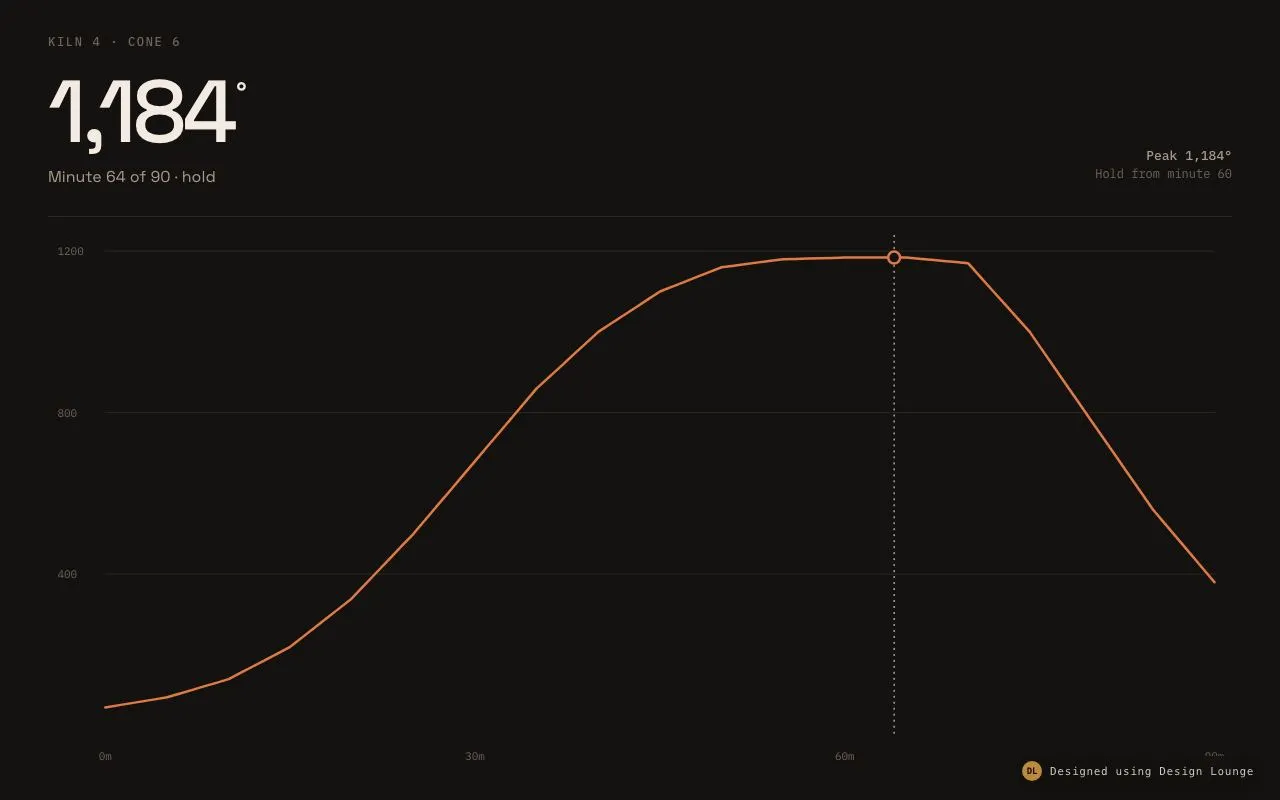
One series for Kiln 4, a fictional pottery studio, on a cone 6 firing. The answer is the temperature, set at 88px: 1,184° at minute 64. Under it, a copper stroke climbs, holds, and cools across 90 minutes. A hairline and one hollow dot mark the minute you are reading. Drag across the plot, or use the arrow keys. There is no tooltip and no second series. The line is the evidence under the number. This is the chart you use when the person has to move through time, not when they only need the latest point.

## Reference behaviour

1. First frame: eyebrow "Kiln 4 · Cone 6" in mono uppercase. The number is 1,184 with a 28px degree mark. The subtitle is "Minute 64 of 90 · hold". At the right, "Peak 1,184°" and "Hold from minute 60". The dot sits on the stroke near the 1,200 gridline. A dashed hairline drops from the dot to the baseline.
2. The series is 19 samples, one every 5 minutes, from 70° at minute 0 to 380° at minute 90. The peak is 1,184° at minutes 60 and 65. Values between samples are linear.
3. Pointer down on the plot sets the minute from the x position, 0 at the left of the hit area and 90 at the right, rounded to a whole minute. Pointer move while the button is down keeps updating. Releasing keeps the last minute.
4. The hit target is the plot inset: 56px left, 16px right, 18px top, 32px bottom. That inset matches the SVG plot padding, so the finger and the dot agree.
5. ArrowRight and ArrowUp add one minute, max 90. ArrowLeft and ArrowDown subtract one, min 0. Home goes to 0. End goes to 90. Each key calls `preventDefault`.
6. The subtitle phase is "climb" before minute 30, "approach" before 60, "hold" from 60 through 70, and "cool" after 70.
7. On load the stroke draws once, 800ms, `cubic-bezier(.2,.7,.2,1)`, from empty to full, using `stroke-dashoffset`. The number, the dot, and the hairline are already in place. They do not wait for the draw.
8. Reduced motion: the stroke is complete on the first frame. Scrubbing still works.
9. There is no floating label on the stroke. The 88px number is the value.
10. The hit area is a `role="slider"` with `aria-valuemin="0"`, `aria-valuemax="90"`, `aria-valuenow` set to the minute, and `aria-valuetext` like "Minute 64, 1184 degrees".

## Structure

```
1280 × 800, padding 36px 48px 32px
KILN 4 · CONE 6
1,184°                                      Peak 1,184°
Minute 64 of 90 · hold                      Hold from minute 60
┌ plot ─────────────────────────────────────────────────────────┐
│ 1200 ─────────────────────────────────────────●─────────────  │
│  800                                          │               │
│  400                                          │               │
│      0m            30m           60m         90m              │
└───────────────────────────────────────────────────────────────┘
```

- The page is the chart. No card inside a card.
- `.num` is a paragraph, 88/500 Space Grotesk, tracking −0.045em. The degree is a `<sup>` at 28px, `vertical-align: top`, `top: 10px`, so it sits on the cap of the digits and does not climb into the eyebrow.

… 119 more lines. Copy or download for the full brief. Loading the source…Brief
159 linesBuild brief for a coding agent. Rebuild this piece in the reader’s stack. If they haven’t said which stack, ask once, then default to semantic HTML + CSS + a little vanilla JS. Match the numbers below; don’t “improve” them.
What it is
One series for Kiln 4, a fictional pottery studio, on a cone 6 firing. The answer is the temperature, set at 88px: 1,184° at minute 64. Under it, a copper stroke climbs, holds, and cools across 90 minutes. A hairline and one hollow dot mark the minute you are reading. Drag across the plot, or use the arrow keys. There is no tooltip and no second series. The line is the evidence under the number. This is the chart you use when the person has to move through time, not when they only need the latest point.
Reference behaviour
- First frame: eyebrow “Kiln 4 · Cone 6” in mono uppercase. The number is 1,184 with a 28px degree mark. The subtitle is “Minute 64 of 90 · hold”. At the right, “Peak 1,184°” and “Hold from minute 60”. The dot sits on the stroke near the 1,200 gridline. A dashed hairline drops from the dot to the baseline.
- The series is 19 samples, one every 5 minutes, from 70° at minute 0 to 380° at minute 90. The peak is 1,184° at minutes 60 and 65. Values between samples are linear.
- Pointer down on the plot sets the minute from the x position, 0 at the left of the hit area and 90 at the right, rounded to a whole minute. Pointer move while the button is down keeps updating. Releasing keeps the last minute.
- The hit target is the plot inset: 56px left, 16px right, 18px top, 32px bottom. That inset matches the SVG plot padding, so the finger and the dot agree.
- ArrowRight and ArrowUp add one minute, max 90. ArrowLeft and ArrowDown subtract one, min 0. Home goes to 0. End goes to 90. Each key calls
preventDefault. - The subtitle phase is “climb” before minute 30, “approach” before 60, “hold” from 60 through 70, and “cool” after 70.
- On load the stroke draws once, 800ms,
cubic-bezier(.2,.7,.2,1), from empty to full, usingstroke-dashoffset. The number, the dot, and the hairline are already in place. They do not wait for the draw. - Reduced motion: the stroke is complete on the first frame. Scrubbing still works.
- There is no floating label on the stroke. The 88px number is the value.
- The hit area is a
role="slider"witharia-valuemin="0",aria-valuemax="90",aria-valuenowset to the minute, andaria-valuetextlike “Minute 64, 1184 degrees”.
Structure
1280 × 800, padding 36px 48px 32px
KILN 4 · CONE 6
1,184°                                      Peak 1,184°
Minute 64 of 90 · hold                      Hold from minute 60
┌ plot ─────────────────────────────────────────────────────────┐
│ 1200 ─────────────────────────────────────────●─────────────  │
│  800                                          │               │
│  400                                          │               │
│      0m            30m           60m         90m              │
└───────────────────────────────────────────────────────────────┘- The page is the chart. No card inside a card.
.numis a paragraph, 88/500 Space Grotesk, tracking −0.045em. The degree is a<sup>at 28px,vertical-align: top,top: 10px, so it sits on the cap of the digits and does not climb into the eyebrow..sideis right-aligned mono: one 13px line, one 12px line in#6f655c.- The plot is
flex: 1under a 1px#2c2824top rule, withmargin-top: 28px. - The SVG viewBox is the plot’s pixel size, measured on load, so the stroke is not stretched. Gridlines at 400, 800, and 1200. X labels at 0m, 30m, 60m, 90m.
- Y maps 0–1240° onto the inner plot height. X maps 0–90 onto the inner width.
- Hairline: 1px
#f3ebe2, dash2 4. Dot: r 6, fill#141210, stroke#e07a45at 2.5px. - The slider is an empty div over the inner plot,
cursor: ew-resize.
Samples, minute → degrees: 0:70, 5:95, 10:140, 15:220, 20:340, 25:500, 30:680, 35:860, 40:1000, 45:1100, 50:1160, 55:1180, 60:1184, 65:1184, 70:1170, 75:1000, 80:780, 85:560, 90:380.
Tokens
:root {
  --bg: #141210;
  --ink: #f3ebe2;         /* number, hairline */
  --ink-2: #a89b8c;       /* subtitle, peak label */
  --ink-3: #6f655c;       /* eyebrow, axis */
  --line: #2c2824;        /* grid and plot rule */
  --stroke: #e07a45;      /* the one series, the dot, focus */
  --font: "Space Grotesk", system-ui, sans-serif;
  --mono: "IBM Plex Mono", ui-monospace, monospace;
  --ease: cubic-bezier(.2, .7, .2, 1);
}
Plot padding, in SVG units that equal pixels: left 56, right 16, top 18, bottom 32.
Typography
| Role | Family | Size | Weight | Line-height | Tracking | Case |
|---|---|---|---|---|---|---|
| Eyebrow | IBM Plex Mono | 12px | 500 | 1 | +0.14em | uppercase |
| Temperature | Space Grotesk | 88px | 500 | 1 | −0.045em | numerals |
| Degree mark | Space Grotesk | 28px | 500 | 1 | 0 | — |
| Subtitle | Space Grotesk | 16px | 400 | 1.4 | 0 | sentence |
| Peak | IBM Plex Mono | 13px | 500 | 1 | 0 | sentence |
| Peak note | IBM Plex Mono | 12px | 400 | 1 | 0 | sentence |
| Axis | IBM Plex Mono | 11px | 400 | 1 | 0 | numerals |
Motion
| Element | Trigger | Property | From → To | Duration | Easing | Notes |
|---|---|---|---|---|---|---|
| Stroke | load | stroke-dashoffset | path length → 0 | 800ms | --ease | once |
| Dot and hairline | scrub | cx, cy, x1, x2 | previous minute → next | 0 | — | they jump, the number jumps with them |
| Number | scrub | text | previous degree → next | 0 | — | no counter animation |
Reduced motion: do not set the dash offset. The stroke is painted full.
States
- Rest: minute 64, 1,184°, phase “hold”, dot on the stroke.
- Dragging: the minute follows x. The number, subtitle, hairline, dot,
aria-valuenow, andaria-valuetextupdate together. - Key: one minute per arrow. Home and End jump to the ends.
- Focus-visible on the slider:
outline: 2px solid var(--stroke); outline-offset: 4px. - After pointer up: the last minute stays. Moving the pointer without the button down does nothing.
Accessibility
- The plot SVG is
aria-hidden. The slider has the accessible name “Minute on the firing curve”. aria-valuetextincludes the minute and the rounded degree, for example “Minute 9, 132 degrees”.- Do not add a tooltip. The display number is the value, and a tooltip would cover the stroke.
- Keyboard users must be able to reach the slider by Tab and move it without a pointer.
- Contrast:
#f3ebe2on#141210is above 14:1.#a89b8con the ground is about 7:1.#6f655cis about 4.6:1 and is only used at 11–12px for axis and eyebrow. The copper stroke is a line, not text. - The hit area is the inner plot, which is most of the lower 500px. That is the drag target. The visible dot is the indicator, not the only target.
Responsive rules
- ≥ 1280: as drawn. Measure the plot and set the SVG viewBox to that pixel size.
- 1024–1279: the number drops to 72px. The side note wraps under the subtitle, left aligned.
- 768–1023: number 64px. Axis labels stay. The hit area remains the inner plot.
- < 768: number 56px. Y labels 400 and 1200 only. Dragging still sets the minute. If the plot is under 200px tall, keep the stroke and drop the hairline dash so the dot stays readable.
Acceptance checklist
Always
- One stroke, one dot, one hairline. No area fill, no legend, no tooltip.
- The display number is the degree at the current minute, updated as you drag.
- Dragging uses the inner plot, and the dot’s x matches the pointer’s x.
- Arrow keys move one minute. Home and End reach the ends.
- The stroke draws once on load, 800ms. Reduced motion shows it complete.
-
aria-valuenowandaria-valuetextmatch the visible minute and degree. - The SVG is measured to the plot’s pixels so the dot stays a circle.
This demo
- The series matches the 19 samples, and minute 64 reads 1,184°.
- Phases are climb, approach, hold, and cool at the minute breaks above.
- Eyebrow is “Kiln 4 · Cone 6”. Peak note is “Hold from minute 60”.
- Stroke colour is
#e07a45on#141210.
Implementation notes
Interpolate between the 5-minute samples. Do not snap the drag to those samples. The minute is an integer. The degree is the rounded interpolation.
function tempAt(min) {
  var x = min / 5, i = Math.floor(x), f = x - i;
  if (i >= temps.length - 1) return temps[temps.length - 1];
  return temps[i] + (temps[i + 1] - temps[i]) * f;
}
Size the SVG to the plot so preserveAspectRatio never stretches the dot:
var box = plot.getBoundingClientRect();
svg.setAttribute('viewBox', '0 0 ' + Math.round(box.width) + ' ' + Math.round(box.height));
Draw the stroke with a dash equal to getTotalLength(), then clear the offset on the next frame. Leave the dot and the number out of that animation.
Common mistakes: a tooltip on the dot; an area fill under the stroke; mapping x from the whole plot while the line is inset, so the dot lags the pointer; putting the degree mark so high that it collides with the eyebrow.
Details
- Palette
- Type
- Space Grotesk · IBM Plex Mono
- Motion
- Subtle motion
- Build
- One session
- Tags