Nº 001 of 677
Analytics dashboard overview
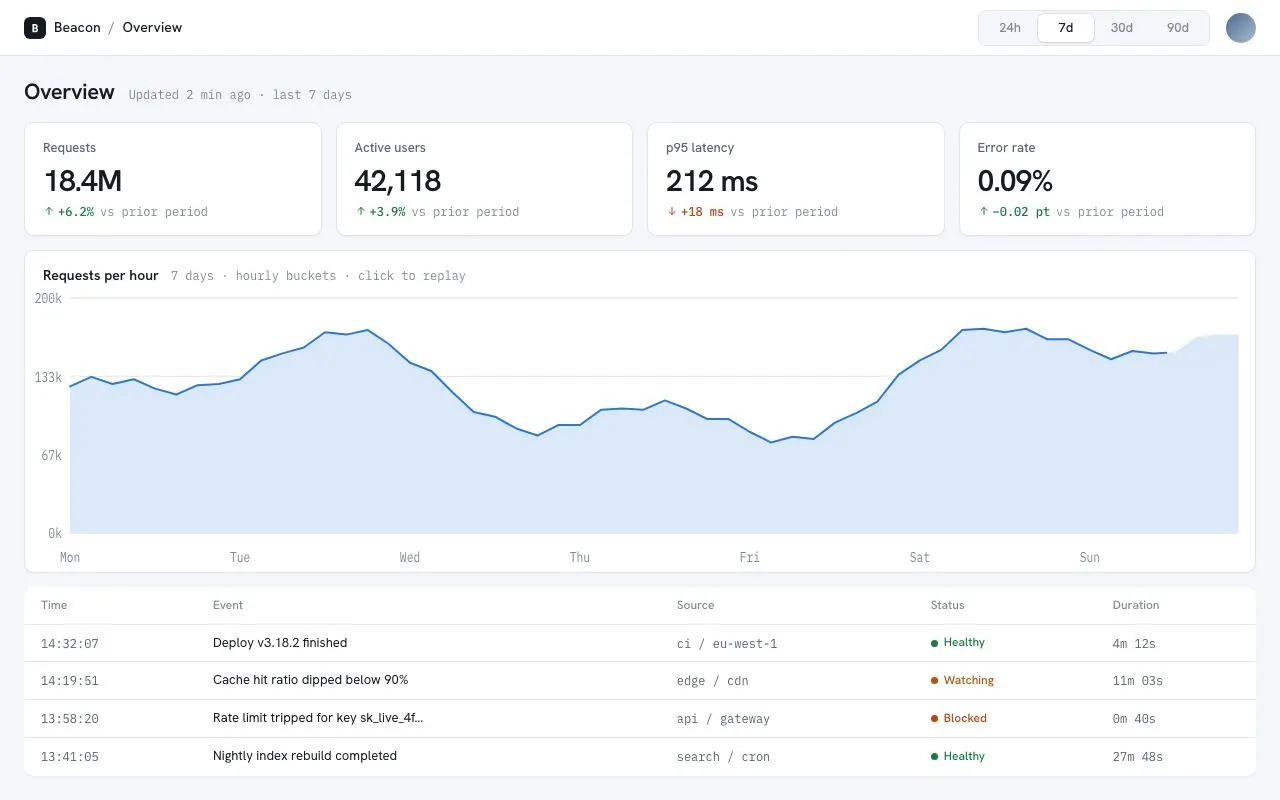
Light analytics overview: four KPI tiles, a single-series area chart drawn as inline SVG with an animated stroke, a crosshair tooltip, a recent-events table and a sliding date-range segmented control.
Preview
Use it
Free to use · credit appreciated1 Once, in your project · Node 22.20+
npx skills add SusanAcharya/Design-Lounge 2 Then ask
Using the Design Lounge skill, build "Analytics dashboard overview" (piece analytics-dashboard-overview) in my stack. Match its brief; restyle it onto my product's theme.
No skill? Paste the brief instead. It carries the numbers, tokens and behaviour.
<!-- Design Lounge Nº 001 · "Analytics dashboard overview" · www.designlounge.live -->

# Analytics dashboard overview

> **Build brief for a coding agent.** Rebuild this piece in the reader's stack. If they haven't said which stack, ask once, then default to semantic HTML + CSS + a little vanilla JS. Match the numbers below; don't "improve" them.

## What it is

The overview page of *Beacon*, a product-analytics tool. Cool light theme: `#f4f6f9` page, white cards with 1px `#e2e6ec` borders and a 1px shadow. A 56px top bar holds the breadcrumb and a four-option date-range segmented control whose white thumb slides between options. Below: a row of four KPI tiles (label, 30px value, signed mono delta with an arrow), a single-series area chart drawn with inline SVG whose 2px blue line draws itself over 1.1s before the fill fades in, and a four-row recent-events table. Hovering the chart snaps a dashed crosshair and a dot to the nearest point with a dark tooltip. The detail worth copying is the chart: pure SVG paths generated from an array, `stroke-dasharray` equal to the measured path length, redrawn whenever the range changes.

## Reference behaviour

1. Initial state: "7d" is pressed in the segmented control; KPIs show 18.4M / 42,118 / 212 ms / 0.09%; the chart's line draws from left to right over 1100ms (expo-out), then the light-blue area fades in over 500ms. Y axis reads 0k / 67k / 133k / 200k; X axis shows Mon…Sun.
2. Move the pointer over the chart: a 1px dashed vertical crosshair and a 4px-radius white dot with a 2px blue ring snap to the nearest data point. A tooltip (dark, 12px mono) appears 12px above the point reading e.g. "142k requests" with the bucket label beneath. Leaving the SVG hides all three.
3. Click "24h", "30d" or "90d": the thumb slides to the pressed option over 220ms; the chart regenerates its data (24 / 30 / 45 points), rebuilds grid, axis labels and paths, and replays the draw. The subtitle under the chart title and the "Updated … last N days" line update.
4. Click anywhere on the chart: replays the draw for the current range.
5. Hover a table row: cells tint to `--bg`.
6. Hover a segmented option: its label darkens from `--ink-3` to `--ink` over 150ms.
7. Reduced motion: the line appears fully drawn and the area is visible immediately; the thumb still moves (1ms).

## Structure

```
1280 × 800
┌─────────────────────────────────────────────────────────────────────────────┐
│ [B] Beacon / Overview                        [24h | 7d | 30d | 90d ]  (o)   │ 56  top bar
├─────────────────────────────────────────────────────────────────────────────┤
│ Overview  Updated 2 min ago · last 7 days                                   │ 22px h1 + mono
│ ┌ Requests ─┐ ┌ Active users ┐ ┌ p95 latency ┐ ┌ Error rate ─┐              │
│ │ 18.4M     │ │ 42,118       │ │ 212 ms      │ │ 0.09%       │              │ 110  KPI tiles
│ │ ↑+6.2% …  │ │ ↑+3.9% …     │ │ ↓+18 ms …   │ │ ↑−0.02 pt … │              │
│ └───────────┘ └──────────────┘ └─────────────┘ └─────────────┘              │
│ ┌ Requests per hour  7 days · hourly buckets · click to replay ───────────┐ │
│ │200k ───────────────────────────────────────────────────────────────── │ │
│ │133k ─────╱╲──────────────────────────────╱‾‾‾╲───────────╱‾‾ ──────── │ │ ~320 chart card
│ │ 67k ╱‾‾‾╱  ╲____╱‾‾╲______╱‾‾‾╲_______╱      ╲_________╱             │ │ (svg viewBox 1200×220)
│ │  0k Mon    Tue    Wed    Thu    Fri    Sat    Sun                      │ │
│ └────────────────────────────────────────────────────────────────────────┘ │
│ ┌ Time     Event                          Source        Status   Duration ┐│
│ │ 14:32:07 Deploy v3.18.2 finished        ci / eu-west-1 ● Healthy 4m 12s ││ 4 rows × 38

… 179 more lines. Copy or download for the full brief. Loading the source…Brief
219 linesBuild brief for a coding agent. Rebuild this piece in the reader’s stack. If they haven’t said which stack, ask once, then default to semantic HTML + CSS + a little vanilla JS. Match the numbers below; don’t “improve” them.
What it is
The overview page of Beacon, a product-analytics tool. Cool light theme: #f4f6f9 page, white cards with 1px #e2e6ec borders and a 1px shadow. A 56px top bar holds the breadcrumb and a four-option date-range segmented control whose white thumb slides between options. Below: a row of four KPI tiles (label, 30px value, signed mono delta with an arrow), a single-series area chart drawn with inline SVG whose 2px blue line draws itself over 1.1s before the fill fades in, and a four-row recent-events table. Hovering the chart snaps a dashed crosshair and a dot to the nearest point with a dark tooltip. The detail worth copying is the chart: pure SVG paths generated from an array, stroke-dasharray equal to the measured path length, redrawn whenever the range changes.
Reference behaviour
- Initial state: “7d” is pressed in the segmented control; KPIs show 18.4M / 42,118 / 212 ms / 0.09%; the chart’s line draws from left to right over 1100ms (expo-out), then the light-blue area fades in over 500ms. Y axis reads 0k / 67k / 133k / 200k; X axis shows Mon…Sun.
- Move the pointer over the chart: a 1px dashed vertical crosshair and a 4px-radius white dot with a 2px blue ring snap to the nearest data point. A tooltip (dark, 12px mono) appears 12px above the point reading e.g. “142k requests” with the bucket label beneath. Leaving the SVG hides all three.
- Click “24h”, “30d” or “90d”: the thumb slides to the pressed option over 220ms; the chart regenerates its data (24 / 30 / 45 points), rebuilds grid, axis labels and paths, and replays the draw. The subtitle under the chart title and the “Updated … last N days” line update.
- Click anywhere on the chart: replays the draw for the current range.
- Hover a table row: cells tint to
--bg. - Hover a segmented option: its label darkens from
--ink-3to--inkover 150ms. - Reduced motion: the line appears fully drawn and the area is visible immediately; the thumb still moves (1ms).
Structure
1280 × 800
┌─────────────────────────────────────────────────────────────────────────────┐
│ [B] Beacon / Overview                        [24h | 7d | 30d | 90d ]  (o)   │ 56  top bar
├─────────────────────────────────────────────────────────────────────────────┤
│ Overview  Updated 2 min ago · last 7 days                                   │ 22px h1 + mono
│ ┌ Requests ─┐ ┌ Active users ┐ ┌ p95 latency ┐ ┌ Error rate ─┐              │
│ │ 18.4M     │ │ 42,118       │ │ 212 ms      │ │ 0.09%       │              │ 110  KPI tiles
│ │ ↑+6.2% …  │ │ ↑+3.9% …     │ │ ↓+18 ms …   │ │ ↑−0.02 pt … │              │
│ └───────────┘ └──────────────┘ └─────────────┘ └─────────────┘              │
│ ┌ Requests per hour  7 days · hourly buckets · click to replay ───────────┐ │
│ │200k ───────────────────────────────────────────────────────────────── │ │
│ │133k ─────╱╲──────────────────────────────╱‾‾‾╲───────────╱‾‾ ──────── │ │ ~320 chart card
│ │ 67k ╱‾‾‾╱  ╲____╱‾‾╲______╱‾‾‾╲_______╱      ╲_________╱             │ │ (svg viewBox 1200×220)
│ │  0k Mon    Tue    Wed    Thu    Fri    Sat    Sun                      │ │
│ └────────────────────────────────────────────────────────────────────────┘ │
│ ┌ Time     Event                          Source        Status   Duration ┐│
│ │ 14:32:07 Deploy v3.18.2 finished        ci / eu-west-1 ● Healthy 4m 12s ││ 4 rows × 38
│ └─────────────────────────────────────────────────────────────────────────┘│
└─────────────────────────────────────────────────────────────────────────────┘
 24px page padding · 14px gaps
<header class="top">— flex, 56px, white, 1px bottom border..crumb(22px logo square, product, slash, page),.seg(role="group" aria-label="Date range", four<button aria-pressed>),.avatar.<main>— grid rowsauto auto 1fr auto, gap 14px, padding20px 24px 24px..head—<h1>+ mono status span.<section class="kpis">— 4-col grid of.kpicards:<h3>label,.vvalue,.ddelta row.<section class="chart">— card with<header>(h2 + mono subtitle),<svg viewBox="0 0 1200 220" preserveAspectRatio="none">containingg.grid,g.axis,path#area,path#line,line#xh,circle#dot; and an HTML.tippositioned absolutely inside the card.<table aria-label="Recent events">— thead + 4 body rows; status cells use.pillspans with a 7px dot.
Tokens
:root {
  /* colour — cool neutrals, one blue series hue, three status inks */
  --bg:          #f4f6f9;  /* page, row hover, segmented track */
  --surface:     #ffffff;  /* cards, top bar, thumb */
  --line:        #e2e6ec;  /* borders, chart grid */
  --line-2:      #cfd5de;  /* crosshair */
  --ink:         #161a21;  /* text, tooltip surface */
  --ink-2:       #596270;  /* KPI labels, mono cells */
  --ink-3:       #7f8896;  /* axis text, table headers, meta */
  --accent:      #2a78d6;  /* series line, dot ring, focus ring */
  --accent-soft: #dbe8fa;  /* area fill */
  --good:        #15803d;  /* positive deltas, Healthy */
  --bad:         #c2410c;  /* negative deltas, Blocked */
  --warn:        #b45309;  /* Watching */
  --tip-muted:   #aeb6c2;  /* tooltip secondary line */

  /* type */
  --sans: "Hanken Grotesk", system-ui, sans-serif;
  --mono: "IBM Plex Mono", ui-monospace, monospace;

  /* layout */
  --top-h: 56px;
  --pad: 24px;
  --gap: 14px;
  --r: 10px;        /* cards */
  --r-sm: 6px;      /* tooltip, thumb */
  --seg-h: 28px;
  --seg-w: 56px;
  --shadow: 0 1px 2px rgba(22, 26, 33, .05);
  --shadow-thumb: 0 1px 2px rgba(22, 26, 33, .12), 0 0 0 1px var(--line);

  /* chart geometry (SVG user units) */
  --vb-w: 1200; --vb-h: 220; --pad-l: 44; --pad-r: 16; --pad-t: 10; --pad-b: 30;

  /* motion */
  --t-micro: 150ms;
  --t-seg: 220ms;
  --t-draw: 1100ms;
  --t-fill: 500ms;
  --ease: cubic-bezier(.2, .7, .2, 1);
  --expo: cubic-bezier(.16, 1, .3, 1);
}
Typography
| Role | Family | Size | Weight | Line-height | Tracking | Notes |
|---|---|---|---|---|---|---|
| Page title | Hanken Grotesk | 22px | 600 | 1.2 | −0.02em | |
| Body / table | Hanken Grotesk | 13–14px | 400 | 1.45 | 0 | |
| Breadcrumb | Hanken Grotesk | 14px | 500 | 1 | 0 | separators --ink-3 |
| Segmented labels | Hanken Grotesk | 13px | 500 | 1 | 0 | |
| KPI label | Hanken Grotesk | 13px | 500 | 1.3 | 0 | --ink-2 |
| KPI value | Hanken Grotesk | 30px | 600 | 1 | −0.03em | proportional figures (not tabular) |
| KPI delta | IBM Plex Mono | 12px | 500 (delta) / 400 (label) | 1.3 | 0 | delta coloured by direction |
| Chart title | Hanken Grotesk | 14px | 600 | 1.3 | 0 | |
| Chart subtitle / meta | IBM Plex Mono | 12px | 400 | 1.3 | 0 | --ink-3 |
| Axis labels | IBM Plex Mono | 11px | 400 | 1 | 0 | --ink-3, SVG <text> |
| Tooltip | IBM Plex Mono | 13px value / 12px label | 500 / 400 | 1.35 | 0 | white on --ink |
| Table header | Hanken Grotesk | 12px | 500 | 1.3 | 0 | --ink-3 |
| Table mono cells | IBM Plex Mono | 12px | 400 | 1.45 | 0 | --ink-2 |
| Status pill | Hanken Grotesk | 12px | 500 | 1 | 0 | dot + label, status colour |
Motion
| Element | Trigger | Property | From → To | Duration | Easing | Notes |
|---|---|---|---|---|---|---|
path#line | load / range / click | stroke-dashoffset | L → 0 (L = getTotalLength()) | 1100ms | --expo | stroke-dasharray: L |
path#area | same | opacity | 0 → 1 | 500ms | --ease | transition-delay: 1100ms so it follows the line |
.seg::before (thumb) | option click | transform, width | previous → pressed option | 220ms | --expo | --x = offsetLeft − 3, --w = offsetWidth |
.seg button | hover / pressed | color | --ink-3 → --ink | 150ms | --ease | |
.tip | pointermove / leave | opacity | 0 ↔ 1 | 150ms | --ease | position set per frame, no transition on position |
#xh, #dot | pointermove / leave | opacity | 0 ↔ 1 | 0 | — | snap; they follow the pointer |
| table row | hover | background | transparent → --bg | 0 | — |
Replay: remove .draw from the card, force reflow, set --len, add .draw. Reduced motion: .draw #line { animation: none; stroke-dashoffset: 0 }, .draw #area { transition: none }.
States
- Segmented option pressed:
aria-pressed="true", label--ink, thumb behind it (white, 6px radius, thumb shadow). - Segmented option hover: label
--ink; thumb does not move until click. - Focus-visible (any control): 2px
--accentoutline, 2px offset. - KPI delta up-good:
--goodwith an up arrow; down-bad:--badwith a down arrow. For p95 latency “up” is bad, so “+18 ms” is coloured--badwith a down arrow; for error rate “−0.02 pt” is coloured--good. Colour = direction × whether up is good, never raw sign. - Chart hover: crosshair, dot and tooltip visible; cursor
crosshair. - Chart drawing: line partially drawn, area hidden; pointer interaction still works during the draw.
- Table row hover: cell background
--bg. - Status pills: Healthy
--good, Watching--warn, Blocked--bad; each has a 7px dot ofcurrentColorand a text label, never colour alone. - No loading skeleton or empty state is drawn; add a 4-tile skeleton if data is async.
Accessibility
- The segmented control is a
role="group"witharia-label="Date range"containing four<button aria-pressed>. Do not userole="tablist"; these are filters, not tabs. - The chart
<svg>isaria-hidden="true"; the<section>hasaria-label="Requests over time"and the table below is the accessible fallback for the values. If the chart is the only source of a number, add a visually hidden<table>mirroring the series. - Tooltip text is written with
textContent, neverinnerHTML, because labels may come from data. - The avatar is
role="img"witharia-label="Signed in as Priya Wendt". - Keyboard order: four range buttons → (chart is not focusable) → nothing else; table rows are static. If rows become links, focus them in reading order.
- Contrast:
--ink-2on white 7.1:1;--ink-3on white 4.5:1 (used at 11–12px for meta only);--good5.0:1;--bad4.6:1;--warn5.1:1; white on--inktooltip 16:1. - Hit targets: segmented buttons 56 × 28 inside a 36px-tall control; table rows 38px.
Responsive rules
- ≥ 1280: as specified; chart SVG stretches to the card width (
preserveAspectRatio="none",vector-effect: non-scaling-strokeon the line keeps it 2px). - 1024–1279: same layout; KPI values may shrink to 26px if tiles drop below 220px.
- 768–1023: KPI grid becomes 2 × 2;
<main>scrolls vertically; chart card height fixed at 280px. - < 768: segmented buttons 48px wide; the Source column is hidden; table cells may wrap the Event column.
- < 640: KPIs single column; chart card 240px tall; tooltip clamps within the card (
leftlimited to 8px…width − 8px).
Acceptance checklist
- Page background is
#f4f6f9; cards are white with 1px#e2e6ecborders, 10px radius and a 1pxrgba(22,26,33,.05)shadow. - Top bar is 56px; the segmented control has four 56 × 28 options with a sliding white thumb that moves over 220ms
cubic-bezier(.16,1,.3,1). - Four KPI tiles show label 13px/500, value 30px/600 proportional figures, and a mono delta coloured by direction × goodness (latency “+18 ms” is orange-red).
- Chart is inline SVG with
viewBox="0 0 1200 220", three horizontal grid lines, y labels 0k/67k/133k/200k, x labels per range. - Line is 2px
#2a78d6and draws left-to-right over 1100ms usingstroke-dasharray/stroke-dashoffsetequal togetTotalLength(). - Area fill
#dbe8fafades in over 500ms only after the line finishes. - Hovering the chart snaps a dashed crosshair and a 4px white dot with a 2px blue ring to the nearest point and shows a dark mono tooltip 12px above it.
- Changing the range regenerates data (24 / 56 / 30 / 45 points), axes and paths, and replays the draw; clicking the chart replays too.
- The “Updated … last N days” line and the chart subtitle reflect the pressed range.
- Table has four rows with mono time/source/duration cells and status pills with a 7px dot plus label.
- Focus rings are visible on the four range buttons.
- Under reduced motion the line and fill are visible immediately.
- No console errors when hovering, clicking or switching ranges rapidly.
Implementation notes
Path from data, then measure for the draw. Build the d string once, reuse it for the area, and read the real length before starting the animation:
const x = i => PL + i * (W - PL - PR) / (data.length - 1);
const y = v => PT + (H - PT - PB) * (1 - v / max);
line.setAttribute('d', data.map((v, i) => (i ? 'L' : 'M') + x(i) + ' ' + y(v)).join(''));
area.setAttribute('d', line.getAttribute('d') + `L${x(data.length - 1)} ${H - PB}L${PL} ${H - PB}Z`);
card.classList.remove('draw'); void card.offsetWidth;          // restart the CSS animation
card.style.setProperty('--len', line.getTotalLength().toFixed(0));
card.classList.add('draw');
.draw #line { stroke-dasharray: var(--len); stroke-dashoffset: var(--len); animation: draw 1100ms var(--expo) forwards; }
.draw #area { opacity: 1; transition: opacity 500ms var(--ease) 1100ms; }
@keyframes draw { to { stroke-dashoffset: 0; } }Crosshair snaps to the nearest X. Convert pointer x into viewBox units, pick the nearest point, and position the HTML tooltip from the card’s coordinate space:
svg.addEventListener('pointermove', e => {
  const r = svg.getBoundingClientRect(), mx = (e.clientX - r.left) / r.width * W;
  let p = pts[0]; for (const q of pts) if (Math.abs(q.x - mx) < Math.abs(p.x - mx)) p = q;
  xh.setAttribute('x1', p.x); xh.setAttribute('x2', p.x); dot.setAttribute('cx', p.x); dot.setAttribute('cy', p.y);
  tip.firstChild.textContent = p.v.toLocaleString() + 'k requests';
  tip.style.left = p.x / W * r.width + 'px';
  tip.style.top = svg.offsetTop + p.y / H * r.height - 12 + 'px';
});
Segmented thumb from measured offsets so any label width works: --x = button.offsetLeft − padding, --w = button.offsetWidth; the thumb is .seg::before with z-index: -1 inside an isolation: isolate container.
Common mistakes: a dual y-axis (never; two measures → two charts); colouring the tooltip text in the series blue (text stays white/muted); using tabular-nums on the 30px KPI values (they are standalone, proportional reads better); forgetting vector-effect: non-scaling-stroke so the stretched SVG thickens the line vertically; labelling every point instead of only the axis ticks.
Details
- Palette
- Type
- Hanken Grotesk · IBM Plex Mono
- Motion
- Subtle motion
- Stack
- Plain HTML, CSS and vanilla JS. No framework or packages, so nothing to clash with your versions.
- Build
- One session
- Tags
On the shelves
Similar
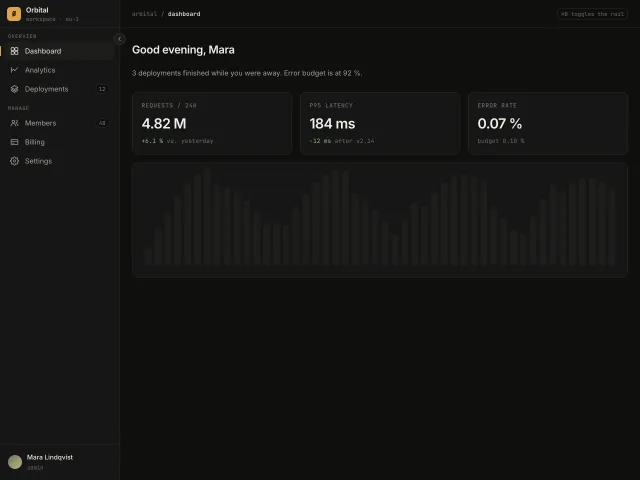
Collapsing sidebar rail
A 240px app sidebar that collapses to a 64px icon rail with hover tooltips, an accent active-route bar and a ⌘B shortcut.
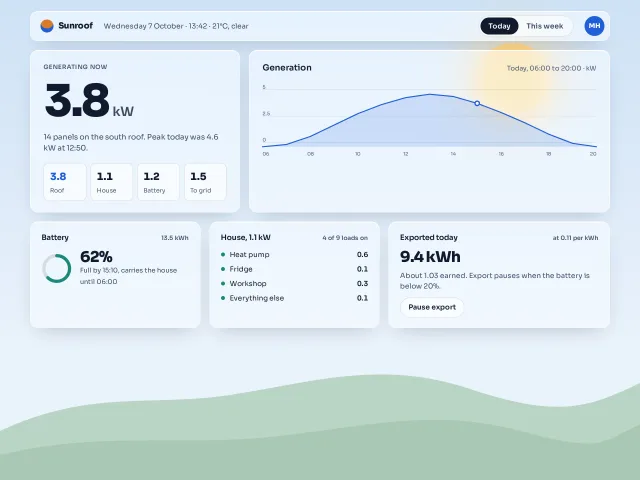
Glass dashboard home
A home-energy dashboard as frosted panels over one drawn sky: a glass bar, an 88px live number, an SVG generation curve, a battery ring and a device list, with a solid fallback.
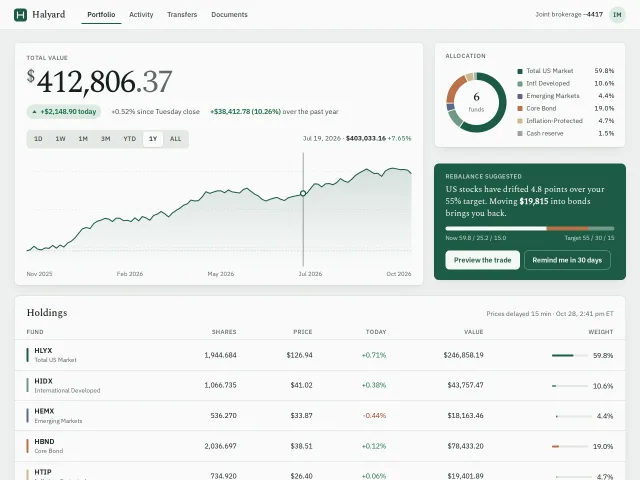
Portfolio dashboard
A calm investing dashboard: a 64px serif total, range tabs over a scrubbable value chart, an allocation ring, a rebalance card and a holdings table.
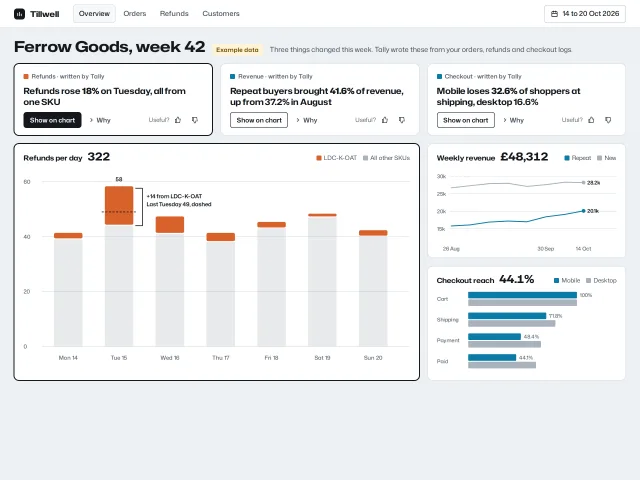
Dashboard with assistant insights
A weekly shop dashboard where an assistant writes three insight cards above the charts; each card lights its chart, explains why, and takes feedback.
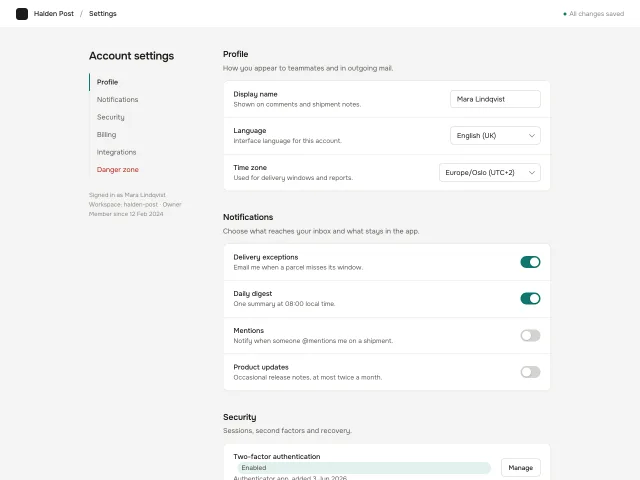
Settings page with sticky nav
Account settings: a 220px sticky section nav with scroll-spy highlight beside a 720px column of grouped setting cards with switches, selects, text inputs and an armed danger zone.
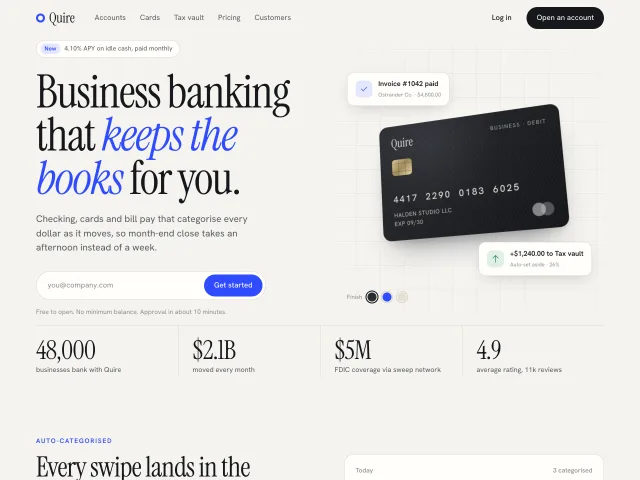
Light fintech landing with tilting card
A warm-paper business banking landing page: serif headline, a CSS debit card that tilts toward the pointer with a moving glare, trust stats, feature rows and a cobalt CTA.