Nº 072 of 520
Tablet ops dashboard grid
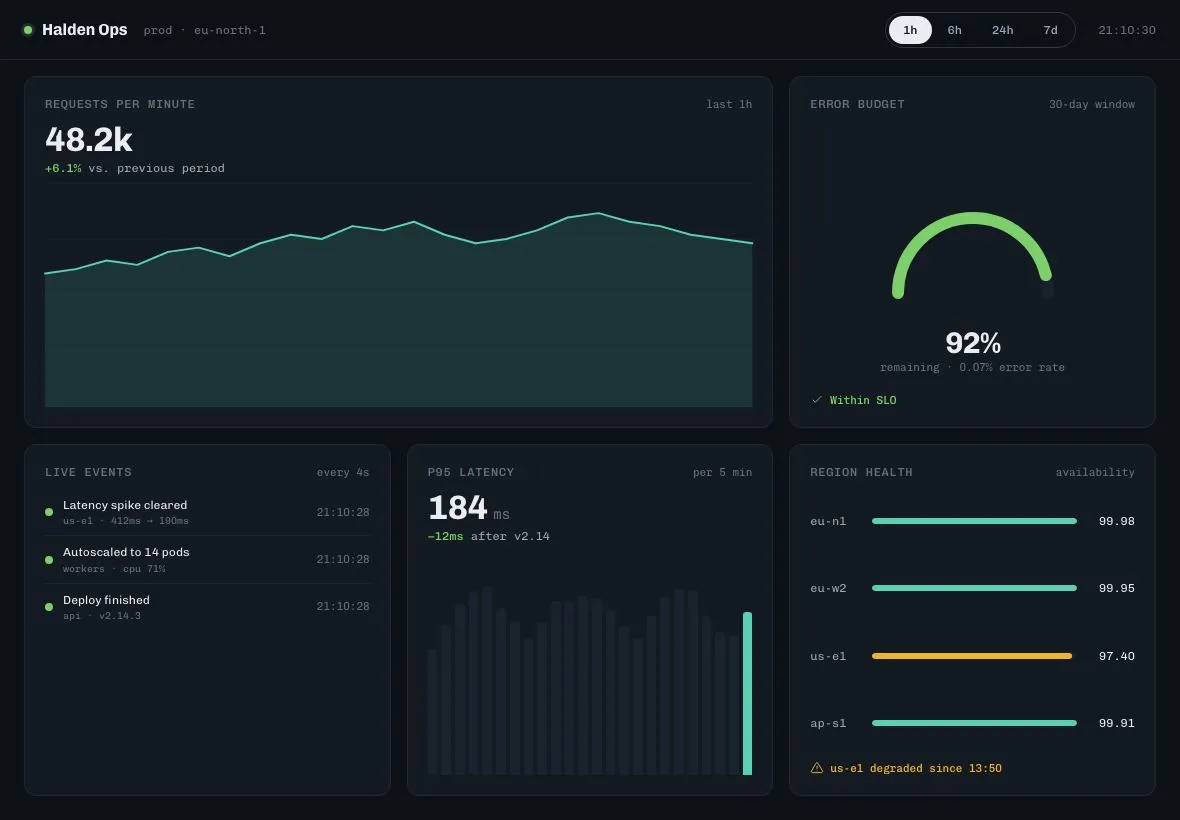
A 1180×820 dark ops dashboard: 3×2 card grid with a crosshair-hover SVG line chart, a dash-offset gauge, a live event list that inserts a row every 4s, and a mono segmented time control.
Preview
Use it
Free to use · credit appreciated1 Once, in your project
npx skills add SusanAcharya/Design-Lounge 2 Then ask
Using the Design Lounge skill, build "Tablet ops dashboard grid" (piece tablet-dashboard-grid) in my stack. Match its brief; restyle it onto my product's theme.
No skill? Paste the brief instead. It carries the numbers, tokens and behaviour.
<!-- Design Lounge Nº 072 · "Tablet ops dashboard grid" · www.designlounge.live -->

# Tablet ops dashboard grid

> **Build brief for a coding agent.** Rebuild this piece in the reader's stack. If they haven't said which stack, ask once, then default to semantic HTML + CSS + a little vanilla JS. Match the numbers below; don't "improve" them.

## What it is

An operations overview for a fictional platform team ("Halden Ops") on a landscape tablet: a 60px top bar with a health dot, environment label and a four-segment time control, then a 3-column × 2-row card grid. The wide card is a single-series requests line chart with a soft area fill, a dashed crosshair and a tooltip that follows the pointer; next to it a half-circle gauge draws its arc with a stroke-dashoffset transition; the second row holds a live event feed that prepends a row every 4 seconds with a slide-in, a p95 latency bar strip and a region availability list. Everything numeric is Chivo Mono; headings and big numbers are Chivo. One teal series colour; green, amber and red are reserved for status and always paired with text or an icon.

## Reference behaviour

1. Initial state: "1h" pressed. Chart shows 24 points, big number "48.2k" with "+6.1% vs. previous period". The gauge arc animates from 0 to 92% over 800ms on load. The feed already holds three rows; the clock in the top bar shows the current time and ticks every second.
2. Every 4000ms a new event row is prepended to the feed: it slides in from −10px with a fade over 360ms while its height grows from 0 to 40px; the list is capped at six rows (the oldest is removed). Rows carry an 8px status dot (green ok, amber warn, red crit), a title, a mono sub-line and a mono timestamp.
3. Click a time segment (6h / 24h / 7d): the pressed segment turns off-white with dark text; the line and area paths morph to the new series over 400ms (same point count, `transition: d`); the big number, delta and "last 6h" label update instantly.
4. Move the pointer over the chart: a dashed vertical crosshair snaps to the nearest of the 24 points, a 10px teal marker with a 2px panel-coloured ring sits on the line, and a tooltip ("52,000 rpm") floats above the point. Leaving the chart hides all three over 160ms.
5. Hover a latency bar: it turns teal and shows its value in a native tooltip; the last bar is always teal (the current bucket).
6. The region list shows four availability bars; us-e1 is amber at 97.40 and the card footer reads "us-e1 degraded since 13:50" with a warning icon in amber.
7. Nothing else is clickable; the piece is a live screen. Reloading replays the gauge draw.

## Structure

```
1180 × 820
┌──────────────────────────────────────────────────────────────────────────────┐
│ ● Halden Ops   prod · eu-north-1                 ( 1h | 6h | 24h | 7d ) 14:32:08 │ 60
├──────────────────────────┬──────────────────────────┬────────────────────────┤
│ REQUESTS PER MINUTE   last 1h                       │ ERROR BUDGET  30-day   │
│ 48.2k                                               │       ╭────────╮       │
│ +6.1% vs. previous period                           │      ╱          ╲      │ gauge 180×110
│   ╱╲    ╱╲___╱‾╲                                    │        92%             │
│ ‾╱  ‾‾‾╱        ‾‾╲_   ← line 2px, area 14%          │  remaining · 0.07%     │
│ ┊ crosshair + tooltip on hover                      │ (ok) Within SLO           │
├──────────────────────────┼──────────────────────────┼────────────────────────┤
│ LIVE EVENTS   every 4s   │ P95 LATENCY   per 5 min  │ REGION HEALTH          │
│ ● Deploy finished  14:32 │ 184ms                    │ eu-n1 ▬▬▬▬▬▬▬▬▬ 99.98  │
│ ● Autoscaled…      14:32 │ −12ms after v2.14        │ eu-w2 ▬▬▬▬▬▬▬▬▬ 99.95  │
│ ● Latency spike…   14:32 │ ▂▃▅▄▃▂▃▅▆▅▄▃▂▃▄▅▆▅▄▃▂▃▄▆ │ us-e1 ▬▬▬▬▬▬▬   97.40  │
│ …(max 6 rows)            │                          │ ap-s1 ▬▬▬▬▬▬▬▬▬ 99.91  │
│                          │                          │ (!) us-e1 degraded…      │

… 196 more lines. Copy or download for the full brief. Loading the source…Brief
236 linesBuild brief for a coding agent. Rebuild this piece in the reader’s stack. If they haven’t said which stack, ask once, then default to semantic HTML + CSS + a little vanilla JS. Match the numbers below; don’t “improve” them.
What it is
An operations overview for a fictional platform team (“Halden Ops”) on a landscape tablet: a 60px top bar with a health dot, environment label and a four-segment time control, then a 3-column × 2-row card grid. The wide card is a single-series requests line chart with a soft area fill, a dashed crosshair and a tooltip that follows the pointer; next to it a half-circle gauge draws its arc with a stroke-dashoffset transition; the second row holds a live event feed that prepends a row every 4 seconds with a slide-in, a p95 latency bar strip and a region availability list. Everything numeric is Chivo Mono; headings and big numbers are Chivo. One teal series colour; green, amber and red are reserved for status and always paired with text or an icon.
Reference behaviour
- Initial state: “1h” pressed. Chart shows 24 points, big number “48.2k” with “+6.1% vs. previous period”. The gauge arc animates from 0 to 92% over 800ms on load. The feed already holds three rows; the clock in the top bar shows the current time and ticks every second.
- Every 4000ms a new event row is prepended to the feed: it slides in from −10px with a fade over 360ms while its height grows from 0 to 40px; the list is capped at six rows (the oldest is removed). Rows carry an 8px status dot (green ok, amber warn, red crit), a title, a mono sub-line and a mono timestamp.
- Click a time segment (6h / 24h / 7d): the pressed segment turns off-white with dark text; the line and area paths morph to the new series over 400ms (same point count,
transition: d); the big number, delta and “last 6h” label update instantly. - Move the pointer over the chart: a dashed vertical crosshair snaps to the nearest of the 24 points, a 10px teal marker with a 2px panel-coloured ring sits on the line, and a tooltip (“52,000 rpm”) floats above the point. Leaving the chart hides all three over 160ms.
- Hover a latency bar: it turns teal and shows its value in a native tooltip; the last bar is always teal (the current bucket).
- The region list shows four availability bars; us-e1 is amber at 97.40 and the card footer reads “us-e1 degraded since 13:50” with a warning icon in amber.
- Nothing else is clickable; the piece is a live screen. Reloading replays the gauge draw.
Structure
1180 × 820
┌──────────────────────────────────────────────────────────────────────────────┐
│ ● Halden Ops   prod · eu-north-1                 ( 1h | 6h | 24h | 7d ) 14:32:08 │ 60
├──────────────────────────┬──────────────────────────┬────────────────────────┤
│ REQUESTS PER MINUTE   last 1h                       │ ERROR BUDGET  30-day   │
│ 48.2k                                               │       ╭────────╮       │
│ +6.1% vs. previous period                           │      ╱          ╲      │ gauge 180×110
│   ╱╲    ╱╲___╱‾╲                                    │        92%             │
│ ‾╱  ‾‾‾╱        ‾‾╲_   ← line 2px, area 14%          │  remaining · 0.07%     │
│ ┊ crosshair + tooltip on hover                      │ (ok) Within SLO           │
├──────────────────────────┼──────────────────────────┼────────────────────────┤
│ LIVE EVENTS   every 4s   │ P95 LATENCY   per 5 min  │ REGION HEALTH          │
│ ● Deploy finished  14:32 │ 184ms                    │ eu-n1 ▬▬▬▬▬▬▬▬▬ 99.98  │
│ ● Autoscaled…      14:32 │ −12ms after v2.14        │ eu-w2 ▬▬▬▬▬▬▬▬▬ 99.95  │
│ ● Latency spike…   14:32 │ ▂▃▅▄▃▂▃▅▆▅▄▃▂▃▄▅▆▅▄▃▂▃▄▆ │ us-e1 ▬▬▬▬▬▬▬   97.40  │
│ …(max 6 rows)            │                          │ ap-s1 ▬▬▬▬▬▬▬▬▬ 99.91  │
│                          │                          │ (!) us-e1 degraded…      │
└──────────────────────────┴──────────────────────────┴────────────────────────┘
grid: 3 cols, 2 rows, 16px gap, 24px side padding; cards 20px padding, 12px radius
<header class="top">—<h1>with health dot,.envlabel,.seg[role=group]of four<button aria-pressed>,.clock.<main class="grid">— five<section class="card" aria-labelledby>elements; the first has.wide(grid-column: span 2).- Chart card:
<h2>(mono label + range span),.big,.delta,.chartwrapper containing an<svg viewBox="0 0 640 200" preserveAspectRatio="none">(grid lines,path.area,path.ln,line.xh) plus HTML.ptmarker and.tip. - Gauge card:
.gaugewith an<svg viewBox="0 0 180 110">(track + arc, bothM15 100 A75 75 0 0 1 165 100),.valoverlay,.statusline. - Feed card:
<ul class="feed">of<li>(<i>dot,.ttitle +<small>,<time>). - Latency card:
.big,.delta,.barsof 24<span>s. - Regions card:
<ul class="regions">rows (.lbl,.bar > i,.v),.statuswarning line.
- Chart card:
Content
- Top bar: “Halden Ops” with a green health dot, “prod · eu-north-1”, segments 1h / 6h / 24h / 7d, live clock (HH:MM:SS).
- Series (24 values each, thousands of rpm; y-scale 10–62): 1h
41 42 44 43 46 47 45 48 50 49 52 51 53 50 48 49 51 54 55 53 52 50 49 48; 6h30 32 35 38 41 44 46 45 47 50 53 55 54 52 50 49 51 53 56 58 57 55 52 48; 24h18 16 15 17 22 28 34 40 46 50 52 54 53 55 57 56 52 47 42 38 34 30 26 22; 7d36 38 40 39 42 44 45 47 44 46 48 50 49 51 53 52 54 56 55 57 58 56 54 52. - Headlines per range: 1h “48.2k” “+6.1%”; 6h “46.9k” “+3.4%”; 24h “39.1k” “−1.2%”; 7d “47.7k” “+8.0%”; delta suffix “vs. previous period”.
- Gauge: “92%” / “remaining · 0.07% error rate” / status “Within SLO”.
- Feed events (title · meta · status), cycled in order: “Deploy finished” · “api · v2.14.3” · ok; “Autoscaled to 14 pods” · “workers · cpu 71%” · ok; “Latency spike cleared” · “us-e1 · 412ms → 190ms” · ok; “Queue depth over 5k” · “billing-jobs” · warn; “Certificate renewed” · “edge · 90 days” · ok; “5xx burst” · “checkout · 38 in 60s” · crit; “Cache warmed” · “catalog · 2.1M keys” · ok; “Node drained” · “eu-n1 · ip-10-4-2-17” · warn.
- Latency card: “184ms”, “−12ms after v2.14”; 24 bars with heights from
150 + |sin(i / 2.3)| × 60 + (i mod 5) × 4ms on a 260ms scale. - Regions: eu-n1 99.98 · eu-w2 99.95 · us-e1 97.40 (warn) · ap-s1 99.91; footer “us-e1 degraded since 13:50”.
Tokens
:root {
  /* colour — cool near-black surfaces, one teal series, reserved status hues */
  --bg: #0c1117;
  --panel: #131a22;
  --panel-2: #1a232d;         /* gauge track, idle bars */
  --line: #1f2933;
  --line-strong: #2c3843;     /* segmented border, crosshair */
  --grid: #1a232d;            /* chart grid lines */
  --ink: #e8edf2;
  --ink-2: #9aa5b1;
  --ink-3: #66717d;           /* labels, axis, timestamps */
  --series: #5ad1b3;          /* the one data colour */
  --series-soft: rgba(90, 209, 179, .14);   /* area fill */
  --good: #7ccf6a;
  --warn: #f0b429;
  --crit: #ef6a6a;
  --seg-on: #e8edf2;
  --seg-on-ink: #0c1117;

  /* type */
  --sans: "Chivo", system-ui, sans-serif;
  --mono: "Chivo Mono", ui-monospace, monospace;

  /* layout */
  --h-top: 60px;
  --gap: 16px;
  --pad: 20px;
  --side: 24px;
  --r: 12px;
  --r-pill: 999px;
  --line-w: 2px;              /* chart line */
  --marker: 10px;
  --gauge-stroke: 12px;
  --gauge-len: 236;           /* arc path length, for dasharray */

  /* motion */
  --t-fast: 160ms;            /* tooltip, marker, segment colour */
  --t-layout: 300ms;
  --t-path: 400ms;            /* path morph */
  --t-row: 360ms;             /* feed row slide */
  --t-gauge: 800ms;
  --tick: 4000ms;             /* feed interval */
  --ease: cubic-bezier(.2, .7, .2, 1);
  --ease-out: cubic-bezier(.16, 1, .3, 1);
}
Typography
| Role | Family | Size | Weight | Line-height | Tracking | Case |
|---|---|---|---|---|---|---|
| UI base | Chivo | 13px | 400 | 1.45 | 0 | sentence |
| App title | Chivo | 16px | 700 | 1.2 | −0.01em | sentence |
| Environment, clock | Chivo Mono | 12px | 400 | 1 | 0 | lowercase / numerals |
| Segment button | Chivo Mono | 12px | 500 | 1 | 0 | as written |
| Card label (h2) | Chivo Mono | 12px | 500 | 1.3 | +0.06em | UPPERCASE |
| Card sub-label | Chivo Mono | 11px | 400 | 1.3 | 0 | sentence |
| Big number | Chivo | 34px | 700 | 1 | −0.03em | tabular numerals |
| Big unit | Chivo Mono | 14px | 400 | 1 | 0 | lowercase |
| Delta line | Chivo Mono | 12px | 400 (value 500) | 1.3 | 0 | sentence |
| Gauge value | Chivo | 30px | 700 | 1 | −0.03em | numerals |
| Status line | Chivo Mono | 11px | 500 | 1.3 | 0 | sentence |
| Feed title | Chivo | 12px | 400 | 1.3 | 0 | sentence |
| Feed meta, time | Chivo Mono | 10px / 11px | 400 | 1.3 | 0 | as written |
| Axis labels | Chivo Mono | 10px | 400 | 1 | 0 | numerals |
| Region rows | Chivo Mono | 12px | 400 | 1.3 | 0 | as written |
| Tooltip | Chivo Mono | 11px | 500 | 1.3 | 0 | numerals |
Motion
| Element | Trigger | Property | From → To | Duration | Easing | Notes |
|---|---|---|---|---|---|---|
.gauge .arc | load | stroke-dashoffset | 236 → 236 × (1 − 0.92) | 800ms | --ease-out | set in a requestAnimationFrame after first paint |
path.ln, path.area | segment change | d | previous → new series | 400ms | --ease | needs identical command count; browsers without d transitions cut |
.feed li | prepend | opacity, translateX, max-height, padding | 0, −10px, 0, 0 → 1, 0, 40px, 8px | 360ms | --ease-out | @keyframes slide, plays once per row |
.chart .xh/.pt/.tip | pointer enter / leave | opacity | 0 ↔ 1 | 160ms | linear | crosshair/marker position updates instantly |
.seg button | pressed | background, color | transparent/--ink-2 → --seg-on/--seg-on-ink | 160ms | linear | |
.bars span | hover | background | --panel-2 → --series | 160ms | linear | |
.clock | every 1000ms | text | — | 0 | — | aria-live="off" |
Reduced motion: every transition and animation is 1ms (the gauge appears full; rows appear in place). The 4s feed interval is unchanged.
States
- Segment pressed:
aria-pressed="true",--seg-onpill with--seg-on-inktext; hover on unpressed raises text to--ink. - Chart hover:
.chart.hovershows the crosshair (1px dashed3 3,--line-strong), the 10px marker (teal, 2px--panelring) and the tooltip (--inkbackground,--bgtext, 6px radius, positionedtranslate(-50%, -110%)from the point). - Feed dot:
--gooddefault,.warnamber,.critred; the title text carries the meaning (“5xx burst”), the dot only reinforces it. - Region bar warn:
.warnfill amber; value stays--ink. - Status line: green check + “Within SLO”, or amber triangle + message; colour is never the only signal.
- Focus-visible (segments, cards if made focusable): 2px
--seriesoutline, 2px offset.
Accessibility
- Each card is a
<section aria-labelledby>its<h2>so the grid reads as five named regions. - The time control is
role="group" aria-label="Time range"of toggle buttons witharia-pressed; only one is pressed. - Chart SVGs are
aria-hidden; the card’s big number, delta and range label already convey the headline. If a table view is required, add a visually hidden<table>of the 24 values under the chart. - The feed is deliberately
aria-live="off": a row every 4 seconds would be disruptive if announced. Expose a “pause feed” control if screen-reader users need to read it. - The clock is
aria-live="off". - Latency bars each carry a
titlewith the value; the strip has anaria-label. - Contrast:
--ink-2on--panel8.6:1;--ink-3on--panel4.5:1 (used for ≥ 10px mono labels);--serieson--panel9.4:1;--warnon--panel10.2:1;--seg-on-inkon--seg-on15.8:1. - Hit targets: segments 28px tall × ≥ 44px wide; on touch tablets raise segment height to 36px.
Responsive rules
- 1180 (reference): 3 × 2 grid; the chart card spans two columns.
- 1024: same grid; card padding 16px; gauge SVG 160×98.
- 768 (portrait): 2 columns × 3 rows; the chart card spans both columns in row 1; segments shrink to
padding: 0 10px. - < 640: single column; cards get a fixed 220px height (chart 260px) and the page scrolls; the top bar wraps the segment control onto a second line.
Acceptance checklist
- Top bar is 60px; the grid is
repeat(3, 1fr)×1fr 1frwith a 16px gap and 24px side padding; the chart card spans two columns. - Segmented control has four
aria-pressedbuttons in Chivo Mono 12px; the pressed one is#e8edf2with#0c1117text. - Changing the range morphs the 24-point line and area over 400ms and updates the big number, delta and “last …” label.
- The line is 2px
#5ad1b3withvector-effect: non-scaling-stroke; the area is the same hue at 14% alpha. - Hovering the chart shows a dashed crosshair snapped to the nearest point, a 10px marker with a 2px panel ring, and a tooltip with the value in rpm; all hide within 160ms of leaving.
- The gauge arc animates
stroke-dashoffsetfrom 236 to 18.9 over 800ms on load; the value reads “92%”. - A new feed row is prepended every 4000ms, slides in over 360ms and the list never exceeds six rows.
- Feed dots use green / amber / red only for status, and every row has descriptive text.
- Latency strip has 24 bars; the last bar and any hovered bar are teal; each bar has a
title. - Region rows are
52px 1fr 48pxgrids; us-e1 bar is amber and the footer warning has an icon. - No
setIntervalfaster than 1000ms; the feed uses 4000ms. - Reduced motion: no slide, gauge appears drawn, chart still updates.
Implementation notes
Path morphing needs equal command counts. Build every series with the same 24 points and the same M … L … structure, then let CSS transition d:
const W = 640, H = 200, N = 24;
const y = v => H - (v - 10) / 52 * H, x = i => i * (W / (N - 1));
function draw(key) {
  pts = series[key].map((v, i) => [x(i), y(v), v]);
  const d = pts.map(([a, b], i) => (i ? 'L' : 'M') + a.toFixed(1) + ' ' + b.toFixed(1)).join(' ');
  line.setAttribute('d', d);
  area.setAttribute('d', d + ` L${W} ${H} L0 ${H} Z`);
}
.chart .ln { stroke: var(--series); stroke-width: 2; vector-effect: non-scaling-stroke; transition: d var(--t-path) var(--ease); }Crosshair on a stretched SVG. With preserveAspectRatio="none" an SVG circle would become an ellipse, so keep the marker and tooltip in HTML and position them by percentage of the viewBox:
chart.addEventListener('pointermove', e => {
  const r = chart.getBoundingClientRect();
  const i = Math.max(0, Math.min(N - 1, Math.round((e.clientX - r.left) / r.width * (N - 1))));
  const [px, py, v] = pts[i];
  xh.setAttribute('x1', px); xh.setAttribute('x2', px);
  marker.style.left = tip.style.left = (px / W * 100) + '%';
  marker.style.top  = tip.style.top  = (py / H * 100) + '%';
  tip.textContent = (v * 1000).toLocaleString('en-GB') + ' rpm';
  chart.classList.add('hover');
});
Feed row insert animates max-height and padding alongside opacity so the rows below shift rather than jump:
.feed li { animation: slide var(--t-row) var(--ease-out); }
@keyframes slide { from { opacity: 0; transform: translateX(-10px); max-height: 0; padding: 0; }
                   to   { opacity: 1; transform: none; max-height: 40px; padding: 8px 0; } }
Common mistakes: a second y-axis for latency on the requests chart (never dual-axis; it is its own card); re-colouring the series when the range changes; announcing the feed as a polite live region; putting the gauge value inside the SVG with preserveAspectRatio="none" (text stretches).
Details
- Palette
- Type
- Chivo · Chivo Mono
- Motion
- Subtle motion
- Build
- One session
- Tags
On the shelves