Nº 119 of 677
KPI row with sparklines
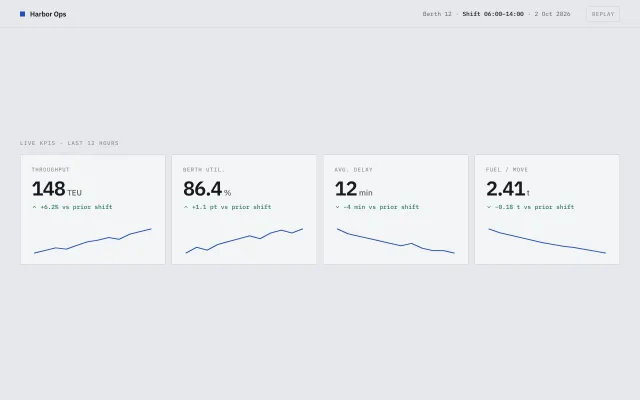
Four Harbor Ops KPI cards: label, large number, signed delta, and an SVG sparkline that draws on load and highlights the nearest point on hover.
Preview
Use it
Free to use · credit appreciated1 Once, in your project · Node 22.20+
npx skills add SusanAcharya/Design-Lounge 2 Then ask
Using the Design Lounge skill, build "KPI row with sparklines" (piece charts-kpi-spark-row) in my stack. Match its brief; restyle it onto my product's theme.
No skill? Paste the brief instead. It carries the numbers, tokens and behaviour.
<!-- Design Lounge Nº 119 · "KPI row with sparklines" · www.designlounge.live -->

# KPI row with sparklines

> **Build brief for a coding agent.** Rebuild this piece in the reader's stack. If they haven't said which stack, ask once, then default to semantic HTML + CSS + a little vanilla JS. Match the numbers below; don't "improve" them.

## What it is

A single dashboard row for Harbor Ops, a fictional container-terminal tool. Four cards in a 12px gap: Throughput, Berth util., Avg. delay, Fuel / move. Each card is a 11px mono label, a 40px tabular number with a unit, a signed delta versus the prior shift, and a 56px-tall SVG sparkline of the last 12 hours. On load each polyline draws itself with `pathLength="1"` and a dashoffset animation. Hovering the spark snaps a 3.5px cobalt dot and a mono tooltip to the nearest of the 12 points. One cobalt, cool gray paper, 2px radii. Replay rebuilds the cards so the lines draw again.

## Reference behaviour

1. Initial state: cool gray page `#e6e8ec`. Header 56px: 10px cobalt square + "Harbor Ops" 14/600, then mono "Berth 12 · **Shift 06:00–14:00** · 2 Oct 2026", then a Replay button.
2. Kicker under the header: "Live KPIs · last 12 hours", 11px mono uppercase `--ink-3`.
3. Four cards, `repeat(4, 1fr)`, gap 12, min-height 220, padding 22/18, background `#f4f5f7`, 1px `#cfd3da` border, radius 2.
4. Card contents, top to bottom: label, number, delta, spark (margin-top auto).
5. Deltas: Throughput `+6.2%` green + chevron-up; Berth util. `+1.1 pt` green + up; Avg. delay `−4 min` green + chevron-down (delay fell, which is good); Fuel / move `−0.18 t` green + down. Colour is `--up` (`#2a7a5a`) for all four because every change is an improvement. Arrow direction follows the sign of the number.
6. On load each spark path uses `pathLength="1"`, `stroke-dasharray: 1`, `stroke-dashoffset: 1`, then animates dashoffset to 0 over 900ms expo-out. Stroke cobalt, 1.75px, round caps.
7. Pointer-move on the SVG: convert clientX into viewBox X (0–160), pick the closest of 12 points, show `.hi` circle and `.tip` with the formatted value (`148 TEU`, `86.4%`, `12 min`, `2.41 t`). Pointer-leave hides the highlight.
8. Replay empties `#row` and rebuilds the four cards so the draw animation runs again.
9. Reduced motion: no draw animation; paths render complete (`stroke-dashoffset: 0`). Hover highlight still works.

## Structure

```
1280 × 800
┌────────────────────────────────────────────────────────────┐
│ ■ Harbor Ops      Berth 12 · Shift 06:00–14:00 · 2 Oct  [Replay] │ 56
├────────────────────────────────────────────────────────────┤
│ LIVE KPIS · LAST 12 HOURS                                  │
│ ┌─────────┐ ┌─────────┐ ┌─────────┐ ┌─────────┐            │
│ │THROUGH. │ │BERTH    │ │AVG DELAY│ │FUEL/MOVE│            │
│ │ 148 TEU │ │ 86.4 %  │ │ 12 min  │ │ 2.41 t  │            │ 40px nums
│ │ +6.2%   │ │ +1.1 pt │ │ −4 min  │ │ −0.18 t │            │
│ │ ╱‾╲╱‾   │ │ ╱‾‾‾    │ │ ╲___    │ │ ╲___    │            │ spark 48
│ └─────────┘ └─────────┘ └─────────┘ └─────────┘            │
│         cards centered in the remaining height             │
└────────────────────────────────────────────────────────────┘
  page padding 40
```

… 139 more lines. Copy or download for the full brief. Loading the source…Brief
179 linesBuild brief for a coding agent. Rebuild this piece in the reader’s stack. If they haven’t said which stack, ask once, then default to semantic HTML + CSS + a little vanilla JS. Match the numbers below; don’t “improve” them.
What it is
A single dashboard row for Harbor Ops, a fictional container-terminal tool. Four cards in a 12px gap: Throughput, Berth util., Avg. delay, Fuel / move. Each card is a 11px mono label, a 40px tabular number with a unit, a signed delta versus the prior shift, and a 56px-tall SVG sparkline of the last 12 hours. On load each polyline draws itself with pathLength="1" and a dashoffset animation. Hovering the spark snaps a 3.5px cobalt dot and a mono tooltip to the nearest of the 12 points. One cobalt, cool gray paper, 2px radii. Replay rebuilds the cards so the lines draw again.
Reference behaviour
- Initial state: cool gray page
#e6e8ec. Header 56px: 10px cobalt square + “Harbor Ops” 14/600, then mono “Berth 12 · Shift 06:00–14:00 · 2 Oct 2026”, then a Replay button. - Kicker under the header: “Live KPIs · last 12 hours”, 11px mono uppercase
--ink-3. - Four cards,
repeat(4, 1fr), gap 12, min-height 220, padding 22/18, background#f4f5f7, 1px#cfd3daborder, radius 2. - Card contents, top to bottom: label, number, delta, spark (margin-top auto).
- Deltas: Throughput
+6.2%green + chevron-up; Berth util.+1.1 ptgreen + up; Avg. delay−4 mingreen + chevron-down (delay fell, which is good); Fuel / move−0.18 tgreen + down. Colour is--up(#2a7a5a) for all four because every change is an improvement. Arrow direction follows the sign of the number. - On load each spark path uses
pathLength="1",stroke-dasharray: 1,stroke-dashoffset: 1, then animates dashoffset to 0 over 900ms expo-out. Stroke cobalt, 1.75px, round caps. - Pointer-move on the SVG: convert clientX into viewBox X (0–160), pick the closest of 12 points, show
.hicircle and.tipwith the formatted value (148 TEU,86.4%,12 min,2.41 t). Pointer-leave hides the highlight. - Replay empties
#rowand rebuilds the four cards so the draw animation runs again. - Reduced motion: no draw animation; paths render complete (
stroke-dashoffset: 0). Hover highlight still works.
Structure
1280 × 800
┌────────────────────────────────────────────────────────────┐
│ ■ Harbor Ops      Berth 12 · Shift 06:00–14:00 · 2 Oct  [Replay] │ 56
├────────────────────────────────────────────────────────────┤
│ LIVE KPIS · LAST 12 HOURS                                  │
│ ┌─────────┐ ┌─────────┐ ┌─────────┐ ┌─────────┐            │
│ │THROUGH. │ │BERTH    │ │AVG DELAY│ │FUEL/MOVE│            │
│ │ 148 TEU │ │ 86.4 %  │ │ 12 min  │ │ 2.41 t  │            │ 40px nums
│ │ +6.2%   │ │ +1.1 pt │ │ −4 min  │ │ −0.18 t │            │
│ │ ╱‾╲╱‾   │ │ ╱‾‾‾    │ │ ╲___    │ │ ╲___    │            │ spark 48
│ └─────────┘ └─────────┘ └─────────┘ └─────────┘            │
│         cards centered in the remaining height             │
└────────────────────────────────────────────────────────────┘
page padding 40<header>flex row. Brand,.shift,#replay.<main>flex column,justify-content: center, padding0 40px 48px.#rowgrid of four<article class="card">built in JS from aKPISarray. Each card:.lbl,.num+<small>unit,.delta,.spark(SVG +<b class="tip">).- Spark SVG
viewBox="0 0 160 56",preserveAspectRatio="none",role="img"andaria-label="{label} trend". PathpathLength="1", circle.hir=3.5.
KPI data (last 12 hours, oldest → newest)
| Label | Number | Unit | Delta | Dir | Series |
|---|---|---|---|---|---|
| Throughput | 148 | TEU | +6.2% | up | 92, 98, 104, 101, 110, 118, 122, 128, 124, 136, 142, 148 |
| Berth util. | 86.4 | % | +1.1 pt | up | 78, 80, 79, 81, 82, 83, 84, 83, 85, 86, 85, 86.4 |
| Avg. delay | 12 | min | −4 min | down | 22, 20, 19, 18, 17, 16, 15, 16, 14, 13, 13, 12 |
| Fuel / move | 2.41 | t | −0.18 t | down | 2.8, 2.74, 2.7, 2.66, 2.62, 2.58, 2.55, 2.52, 2.5, 2.47, 2.44, 2.41 |
Tooltip formatters: v + ' TEU', v.toFixed(1) + '%', v + ' min', v.toFixed(2) + ' t'.
Tokens
:root {
  --bg: #e6e8ec;               /* page */
  --card: #f4f5f7;             /* card surface */
  --ink: #16191e;
  --ink-2: #5a616b;
  --ink-3: #8b929c;
  --line: #cfd3da;
  --cobalt: #1f4ebf;           /* the one accent, spark stroke, mark */
  --up: #2a7a5a;               /* improving delta */
  --down: #b5473a;             /* reserved; unused in this data set */
  --sans: "IBM Plex Sans", system-ui, sans-serif;
  --mono: "IBM Plex Mono", ui-monospace, monospace;
  --gutter: 40px;
  --r: 2px;
  --t-micro: 160ms;
  --t-draw: 900ms;
  --ease: cubic-bezier(.2, .7, .2, 1);
  --expo: cubic-bezier(.16, 1, .3, 1);
}
Typography
| Role | Family | Size | Weight | Line-height | Tracking | Case |
|---|---|---|---|---|---|---|
| Number | IBM Plex Sans | 40px | 600 | 1 | −0.04em | tabular |
| Unit | IBM Plex Sans | 16px | 500 | 1 | 0 | as-is |
| Brand | IBM Plex Sans | 14px | 600 | 1 | −0.01em | Title |
| Label | IBM Plex Mono | 11px | 500 | 1 | +0.1em | UPPERCASE |
| Delta | IBM Plex Mono | 12px | 500 | 1 | 0 | as-is |
| Shift / tip | IBM Plex Mono | 12/11px | 400/500 | 1 | 0 | as-is |
| Kicker | IBM Plex Mono | 11px | 500 | 1 | +0.12em | UPPERCASE |
Numbers use font-variant-numeric: tabular-nums.
Motion
| Element | Trigger | Property | From → To | Duration | Easing |
|---|---|---|---|---|---|
| Spark path | load / replay | stroke-dashoffset | 1 → 0 | 900ms | --expo |
| Tip / dot | pointer enter | opacity | 0 → 1 | 160ms | --ease |
| Replay hover | hover | color, border | ink-3 → ink | 160ms | --ease |
pathLength="1" makes dasharray 1 equal the whole polyline, independent of pixel length. Reduced motion: animation: none; stroke-dashoffset: 0.
States
- Spark hover:
.spark.onreveals.hiand.tip. Leaving restores the last point invisibly (dot hidden). - Delta: class
up→--up. Classdnis in the CSS for regressions but this data set does not use it. - Replay hover: border and type
--ink. - Focus-visible: 2px cobalt outline, 3px offset, on Replay.
Accessibility
- Each spark SVG has
role="img"andaria-labellike “Throughput trend”. The 12 sample values are in the label’s number and delta; the hover tooltip is mouse-only extra detail, not the only place the figure appears. - Cards are
<article>. The row is not a data table; four independent metrics. - Replay is a
<button>. - Contrast: ink on card ~14:1.
--ink-2on card ~6:1. Cobalt on card ~5.5:1 for the 1.75px stroke (decorative).--ink-3is 11px uppercase labels. - Tooltip is
<b class="tip">,pointer-events: none, not a live region (it would chatter on every mouse move).
Responsive rules
- ≥ 1280: four columns, numbers 40px.
- 1024–1279: four columns, numbers 32px, padding 16.
- 768–1023: two columns, two rows. Sparks stay 48px tall.
- < 640: one column. Header stacks brand and shift.
Acceptance checklist
- Exactly four cards in one row at 1280, gap 12, radius 2, cool gray + one cobalt.
- Numbers are 40px/600 IBM Plex Sans, tabular, with a 16px unit.
- Sparklines are inline SVG, 12 points, cobalt 1.75px, viewBox 160×56, and draw 1 → 0 dashoffset over 900ms on load.
- Hovering a spark moves a 3.5px dot and a mono tooltip to the nearest point; leaving hides them.
- Delay and fuel use a down chevron and green type (improvement). Throughput and util use an up chevron.
- Replay rebuilds the row and the lines draw again.
- Reduced motion shows complete lines with no dash animation; hover still works.
- Shift line reads Berth 12, 06:00–14:00, 2 Oct 2026.
- Only IBM Plex Sans and IBM Plex Mono load.
- No chart library, no canvas, no purple.
Implementation notes
Normalise the path to length 1 so every spark draws in the same 900ms:
<path d="M4,30 L…" pathLength="1" />.spark path {
fill: none;
stroke: var(--cobalt);
stroke-width: 1.75;
stroke-dasharray: 1;
stroke-dashoffset: 1;
animation: draw 900ms cubic-bezier(.16, 1, .3, 1) forwards;
}
@keyframes draw { to { stroke-dashoffset: 0; } }Map pointer X to the nearest point, not to a linear interpolation, so the tooltip always matches a real sample:
svg.addEventListener('pointermove', (e) => {
  const r = svg.getBoundingClientRect();
  const x = (e.clientX - r.left) / r.width * 160;
  const best = pts.reduce((a, p) => Math.abs(p.x - x) < Math.abs(a.x - x) ? p : a);
  set(best);
});
Y mapping: y = 56 - 4 - (v - min) / (max - min) * 48. If max === min, use a span of 1 so the line sits in the middle instead of dividing by zero.
Common mistakes: animating stroke-dasharray with a guessed pixel length (the four series have different path lengths, so they finish at different times). Using a filled area under the line. Colouring a falling delay red.
Details
- Palette
- Type
- IBM Plex Sans · IBM Plex Mono
- Motion
- Subtle motion
- Stack
- Plain HTML, CSS and vanilla JS. No framework or packages, so nothing to clash with your versions.
- Build
- One session
- Tags
Similar
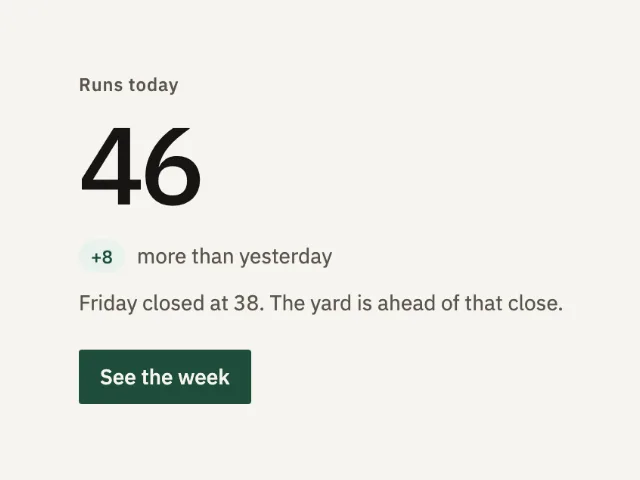
One number, with a delta
A single metric at 72px. The delta is a small badge. Four equal numbers in a row are a different, worse screen.
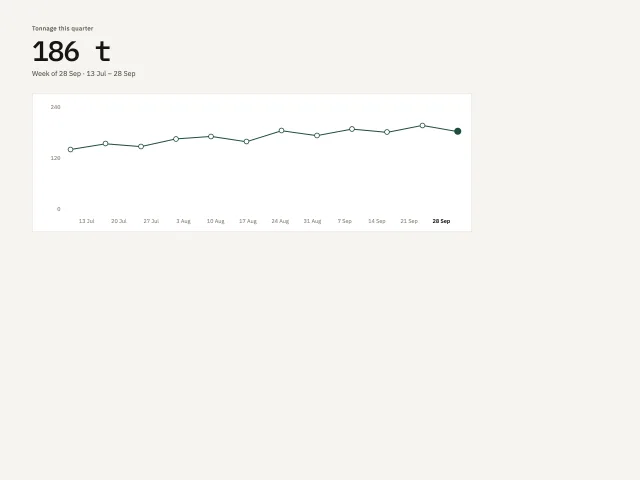
Quarter line chart
Twelve weeks of tonnage as one stroke. The latest week is a 56px number. The line is the evidence under it, not a second headline.
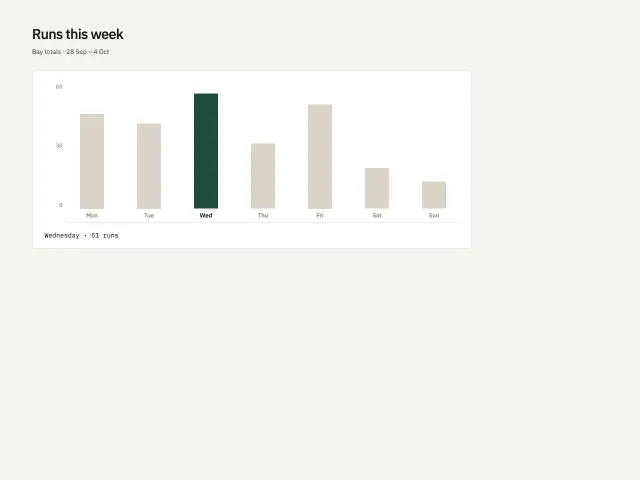
Weekly bar chart
Seven bars for a yard week. One series, one selected day, and a mono readout. No legend, no second colour, no chart theme.
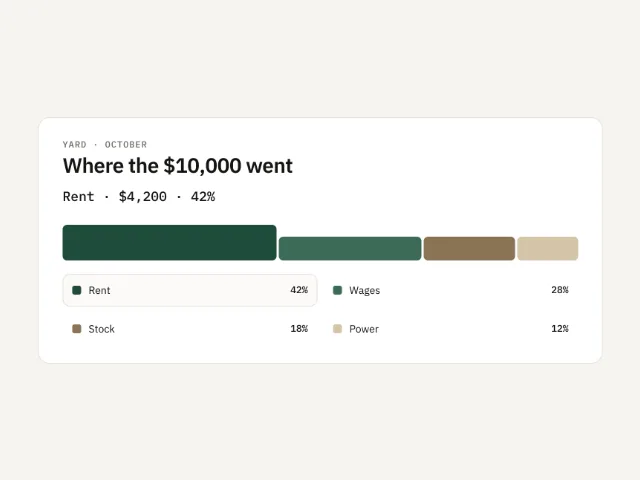
One bar split into shares
A single bar in four shares of one total. The selected share grows to 48px. The readout names the amount. There is no ring.
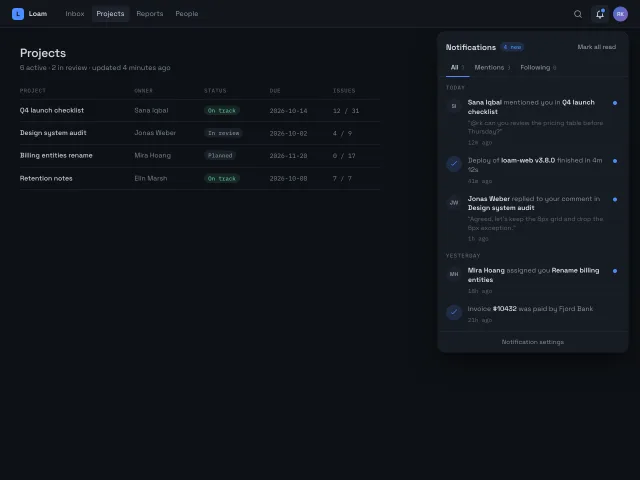
Notification center panel
A bell with an unread dot opens a 380px top-right panel with All/Mentions/Following tabs, Today/Yesterday groups, unread dots that scale away on Mark all read, and an empty tab state.
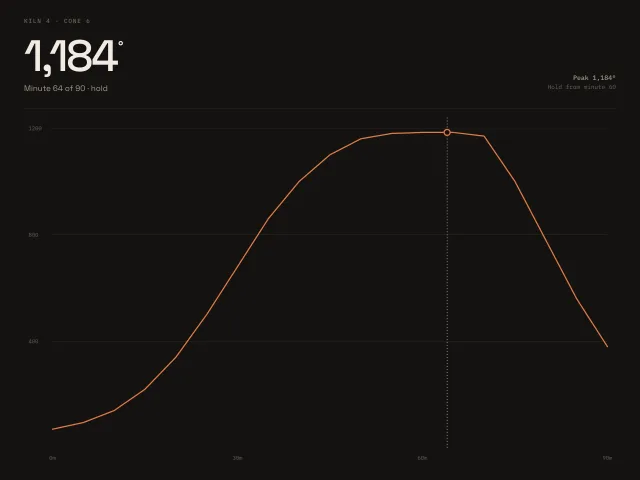
Scrub a firing curve
A 90 minute kiln curve. Drag or press an arrow key. The big number is the degree at that minute.