Nº 577 of 605
Motorsport race results
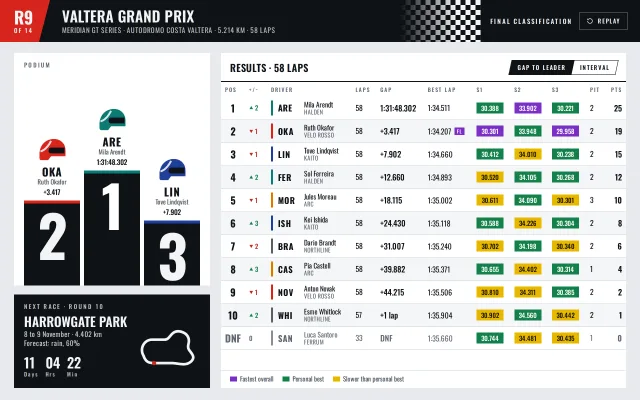
A broadcast-style results screen: a rising podium with giant numerals, a lap table with purple, green and yellow sectors, gap or interval, and a next race card.
Preview
Use it
Free to use · credit appreciated1 Once, in your project · Node 22.20+
npx skills add SusanAcharya/Design-Lounge 2 Then ask
Using the Design Lounge skill, build "Motorsport race results" (piece game-racing-results) in my stack. Match its brief; restyle it onto my product's theme.
No skill? Paste the brief instead. It carries the numbers, tokens and behaviour.
<!-- Design Lounge Nº 577 · "Motorsport race results" · www.designlounge.live -->

# Motorsport race results

> **Build brief for a coding agent.** Rebuild this piece in the reader's stack. If they haven't said which stack, ask once, then default to semantic HTML + CSS + a little vanilla JS. Match the numbers below; don't "improve" them.

## What it is

The post-race results screen of a motorsport game, styled like a TV timing graphic. A black header bar carries a red round badge cut on a slant, the race name and a chequered flag fading in from the left. Below, a podium of three black blocks rises from the floor with 128px numerals and team-coloured top edges, a helmet in each team's colour above. The main sheet is an 11-row classification: position, places gained or lost, driver code with team bar, laps, gap (or interval), best lap, and the three sectors of that lap as solid chips in the timing convention: **purple** for the fastest sector of anyone, **green** for the driver's personal best, **yellow** for slower. A dark next race card with a countdown closes the left column. The detail worth copying: rows wipe in left to right with a 45ms stagger, the way a broadcast graphic builds, and Replay runs the whole build again.

## Reference behaviour

1. On load: podium blocks scale up from the floor (2nd at 120ms, 1st at 240ms, 3rd at 360ms, 640ms each). Table rows wipe in with `clip-path` from the left, 460ms each, staggered 45ms from 200ms.
2. Hover a row: background `#eceef1`. Click or press Enter on a focused row: it becomes selected (`aria-selected="true"`, pale yellow `#fff2c2`); one row at a time.
3. The segmented control (skewed −12°) switches the time column between "Gap to leader" (+7.902) and "Interval" to the car ahead (+4.485). The column header changes to match; rows do not re-animate. The leader always shows race time 1:31:48.302; lapped and retired cars show "+1 lap" and "DNF".
4. Position change column: green up triangle and count, red down triangle and count, or grey 0. A DNF shows "DNF" in the position cell and grey text across the row.
5. The fastest lap carries a small purple "FL" tag after the time; that driver gets one extra point (19).
6. Replay (header, right) re-runs the podium rise and the row wipe.
7. The next race card shows Harrowgate Park, 8 to 9 November, a track outline with a red start dot, and 11 / 04 / 22 for days, hours, minutes.

## Structure

```
1280 × 800
┌────┬─────────────────────────────────────────┬▓▓▓▓flag▓▓┬────────────────────────┐
│ R9 │ VALTERA GRAND PRIX 30px                   │ 160px    │ FINAL CLASSIFICATION [REPLAY]│  84px bar
│of14│ series · circuit · 5.214 km · 58 laps     │          │                        │
├────┴───────────┬─────────────────────────────┴──────────┴────────────────────────┤
│ PODIUM 392     │ RESULTS · 58 LAPS            [GAP TO LEADER|INTERVAL]          │
│  helmet        │══════════════════ 2px rule ═══════════════════════════════════│
│ OKA  ARE  LIN  │ POS +/− DRIVER        LAPS GAP      BEST    S1   S2   S3 PIT PTS│
│ ┌──┐┌──┐┌──┐   │  1  ▲2 ▌ARE Mila…  58 1:31:48 1:34.511 [g] [p] [g]  2  25│
│ │2 ││1 ││3 │   │  …  11 rows × 46px, zebra                                    │
│ └──┘└──┘└──┘   │ DNF  0 ▌SAN …      33 DNF                                     │
├────────────────┤                                                              │
│ NEXT RACE …    │ ■ fastest overall ■ personal best ■ slower                     │
│ 11 04 22  trk  │                                                              │
└────────────────┴──────────────────────────────────────────────────────────────┘
main: grid 392 | minmax(0,1fr), gap 22, padding 22 28 24, height calc(100% − 84px)
```

… 139 more lines. Copy or download for the full brief. Loading the source…Brief
179 linesBuild brief for a coding agent. Rebuild this piece in the reader’s stack. If they haven’t said which stack, ask once, then default to semantic HTML + CSS + a little vanilla JS. Match the numbers below; don’t “improve” them.
What it is
The post-race results screen of a motorsport game, styled like a TV timing graphic. A black header bar carries a red round badge cut on a slant, the race name and a chequered flag fading in from the left. Below, a podium of three black blocks rises from the floor with 128px numerals and team-coloured top edges, a helmet in each team’s colour above. The main sheet is an 11-row classification: position, places gained or lost, driver code with team bar, laps, gap (or interval), best lap, and the three sectors of that lap as solid chips in the timing convention: purple for the fastest sector of anyone, green for the driver’s personal best, yellow for slower. A dark next race card with a countdown closes the left column. The detail worth copying: rows wipe in left to right with a 45ms stagger, the way a broadcast graphic builds, and Replay runs the whole build again.
Reference behaviour
- On load: podium blocks scale up from the floor (2nd at 120ms, 1st at 240ms, 3rd at 360ms, 640ms each). Table rows wipe in with
clip-pathfrom the left, 460ms each, staggered 45ms from 200ms. - Hover a row: background
#eceef1. Click or press Enter on a focused row: it becomes selected (aria-selected="true", pale yellow#fff2c2); one row at a time. - The segmented control (skewed −12°) switches the time column between “Gap to leader” (+7.902) and “Interval” to the car ahead (+4.485). The column header changes to match; rows do not re-animate. The leader always shows race time 1:31:48.302; lapped and retired cars show “+1 lap” and “DNF”.
- Position change column: green up triangle and count, red down triangle and count, or grey 0. A DNF shows “DNF” in the position cell and grey text across the row.
- The fastest lap carries a small purple “FL” tag after the time; that driver gets one extra point (19).
- Replay (header, right) re-runs the podium rise and the row wipe.
- The next race card shows Harrowgate Park, 8 to 9 November, a track outline with a red start dot, and 11 / 04 / 22 for days, hours, minutes.
Structure
1280 × 800
┌────┬─────────────────────────────────────────┬▓▓▓▓flag▓▓┬────────────────────────┐
│ R9 │ VALTERA GRAND PRIX 30px                   │ 160px    │ FINAL CLASSIFICATION [REPLAY]│  84px bar
│of14│ series · circuit · 5.214 km · 58 laps     │          │                        │
├────┴───────────┬─────────────────────────────┴──────────┴────────────────────────┤
│ PODIUM 392     │ RESULTS · 58 LAPS            [GAP TO LEADER|INTERVAL]          │
│  helmet        │══════════════════ 2px rule ═══════════════════════════════════│
│ OKA  ARE  LIN  │ POS +/− DRIVER        LAPS GAP      BEST    S1   S2   S3 PIT PTS│
│ ┌──┐┌──┐┌──┐   │  1  ▲2 ▌ARE Mila…  58 1:31:48 1:34.511 [g] [p] [g]  2  25│
│ │2 ││1 ││3 │   │  …  11 rows × 46px, zebra                                    │
│ └──┘└──┘└──┘   │ DNF  0 ▌SAN …      33 DNF                                     │
├────────────────┤                                                              │
│ NEXT RACE …    │ ■ fastest overall ■ personal best ■ slower                     │
│ 11 04 22  trk  │                                                              │
└────────────────┴──────────────────────────────────────────────────────────────┘
main: grid 392 | minmax(0,1fr), gap 22, padding 22 28 24, height calc(100% − 84px)
<header class="top">:.rnd(red,clip-pathslant 22px),.racewith<h1>,.flag(conic-gradient chequer 20px, masked),.statuswith the Replay<button>..left:<section class="podium">with three.podcolumns in the order 2, 1, 3 (block heights 170, 230, 130px), then<section class="next">.<section class="sheet">: heading row with arole="group"segmented control, a horizontally scrollable.wraparound a real<table>, and a three-item legend.
Tokens
:root {
  --bg: #e8eaed;      /* page */
  --sheet: #ffffff;   /* podium and table panels */
  --row-alt: #f5f6f8; /* zebra */
  --row-hover: #eceef1;
  --row-sel: #fff2c2;
  --line: #d5d9de;    /* row rules */
  --ink: #0f1216;     /* text, header bar, podium blocks */
  --ink-2: #4a525c;
  --ink-3: #5f6873;   /* column heads, team names, DNF */
  --on-bar: #f3f4f6;  /* text on the black bar */
  --bar-meta: #b9c0c8;/* meta on the black bar */
  --red: #d7261e;     /* round badge, focus */
  --purple: #7a2fc4;  /* fastest overall sector, FL tag */
  --green: #14804a;   /* personal best sector, places gained */
  --yellow: #e8b800;  /* slower sector, text #1a1400 */
  --down: #c0281f;    /* places lost */
  /* team colours */
  --halden: #0b7a73; --velo: #d7261e; --kaito: #1f3f99; --arc: #e07800; --northline: #56606b; --ferrum: #8a8f96;
  --font: "Oswald", Impact, sans-serif;
  --row-h: 46px;
  --skew: -12deg;
  --ease: cubic-bezier(.2,.7,.2,1);
  --ease-out: cubic-bezier(.16,1,.3,1);
  --t-wipe: 460ms; --stagger: 45ms; --t-rise: 640ms;
}
Typography
One family, Oswald, always with font-variant-numeric: tabular-nums in the table so times line up.
| Role | Size | Weight | Line-height | Tracking | Case |
|---|---|---|---|---|---|
| Podium numeral | clamp(64px, 9vw, 128px) | 700 | 1 | −.02em | numerals |
| Round badge | 34px | 700 | 1 | 0 | R9 |
| Race title | 30px | 600 | 1 | .01em | upper |
| Next race name | 26px | 600 | 1.05 | 0 | upper |
| Countdown | 28px | 600 | 1 | 0 | numerals |
| Podium code / table code | 22px / 17px | 700 | 1 | .04em | upper |
| Position | 20px | 700 | 1 | 0 | numerals |
| Gap | 16px | 500 | 1 | 0 | signed |
| Driver name | 14px | 400 | 1.15 | 0 | title |
| Sector chip | 13px | 500 | 1 | 0 | numerals |
| Column heads, labels | 11 to 13px | 500 | 1 | .18 to .22em | upper |
Motion
| Element | Trigger | Property | From → To | Duration | Easing | Delay |
|---|---|---|---|---|---|---|
| Podium block | load, Replay | scaleY (origin bottom) | 0 → 1 | 640ms | --ease-out | 2nd 120, 1st 240, 3rd 360ms |
| Table row | load, Replay | clip-path inset right, translateX | 100%, −24px → 0, 0 | 460ms | --ease-out | 200ms + i × 45ms |
| Row | hover | background | instant | 0 | none | |
| Segmented control | click | background | instant | 0 | none |
Restart animations by setting style.animation = 'none', forcing layout, then clearing it. Reduced motion: no rise, no wipe; everything is in place on the first frame.
States
- Row hover:
--row-hover. Row selected:--row-sel,aria-selected="true". Row focus-visible: 3px--redoutline. - DNF row: every cell
--ink-3, position cell reads “DNF”, change cell “0”. - Segment pressed:
--inkfill, white text; unpressed transparent with the shared 1px--inkborder. - Replay hover: border goes from
#6b747fto--on-bar. - Sector chip: purple and green chips carry white text, yellow carries
#1a1400; each has atitlethat names its meaning.
Accessibility
- The classification is a real
<table>with<th>column heads; the time head reads “Gap” or “Interval” with the mode. - Rows are focusable (
tabindex="0") and selectable with Enter or Space. - The segmented control is a group of two buttons with
aria-pressed. - Sector meaning is never colour alone: the legend names all three, and each chip has a
title. The fastest lap also gets a text tag. - The scroll wrapper is focusable with an
aria-label, so keyboard users can scroll it on phones. - Countdown is grouped with
aria-label="Lights out in 11 days 4 hours 22 minutes". - Contrast:
--ink-3on white 5.7:1 (5.2:1 on the zebra row); white on--purple6.9:1, on--green5.0:1;#1a1400on--yellow9.9:1;--bar-metaon--ink10.2:1.
Responsive rules
- ≥ 1280: as drawn, no page scroll.
- 1100 and below: one column; podium and next race sit side by side (1.4 : 1) above the table; the page scrolls.
- 760 and below: header wraps (status row moves under the title, flag hidden), podium and next race stack, podium keeps 380px. The table keeps a 720px minimum inside its own horizontal scroller; the page itself never scrolls sideways.
Acceptance checklist
Always
- Sector chips follow the convention: one purple per sector across the field, green for personal bests, yellow otherwise, with a legend.
- Times use tabular figures and right-sized columns so decimals align.
- Gap and Interval toggle without re-animating; the header label follows.
- Podium order is 2, 1, 3 with heights 170, 230, 130 and team-colour top edges.
- Rows wipe in left to right with a 45ms stagger; Replay re-runs podium and rows.
- Places gained, lost and unchanged read by icon, colour and number.
- Retired and lapped cars are labelled in words, not blanks.
- Reduced motion shows the finished graphic immediately.
- At 390 wide only the table scrolls sideways, inside its wrapper.
This demo
- Valtera Grand Prix, round 9 of 14, 58 laps, winner Mila Arendt in 1:31:48.302 from P3 on the grid.
- Fastest lap 1:34.207 by Ruth Okafor, tagged FL, 19 points.
- Next race Harrowgate Park, 8 to 9 November, countdown 11 / 04 / 22.
- Oswald is the only family.
Implementation notes
The broadcast wipe. A clip-path that opens from the left plus a short slide, staggered by a custom property set inline per row:
tbody tr{animation:wipe 460ms var(--ease-out) both;animation-delay:calc(var(--i) * 45ms + 200ms)}
@keyframes wipe{from{clip-path:inset(0 100% 0 0);transform:translateX(-24px)}to{clip-path:inset(0 0 0 0)}}
Chequered flag in one gradient. A conic gradient tiles into a chequer; a mask fades it in from the left so it never fights the title:
.flag{width:160px;
  background:conic-gradient(#f3f4f6 25%,#0f1216 0 50%,#f3f4f6 0 75%,#0f1216 0) 0 0/20px 20px;
  mask:linear-gradient(90deg,transparent,#000 70%)}
Interval from gap. Store every car’s gap to the leader in seconds; interval is the difference from the car above. Keep strings (“+1 lap”, “DNF”) as strings:
const g = i === 0 ? '1:31:48.302'
  : typeof r.gap === 'string' ? r.gap
  : mode === 'gap' ? '+' + r.gap.toFixed(3) : '+' + (r.gap - R[i - 1].gap).toFixed(3);
Common mistakes: yellow chips with white text (fails contrast); purple used for more than one driver in a sector; proportional figures that make the time column ragged; letting the whole page scroll sideways on phones instead of the table.
Details
- Palette
- Type
- Oswald
- Motion
- Rich motion
- Build
- One session
- Tags
Similar
Sci-fi loadout screen
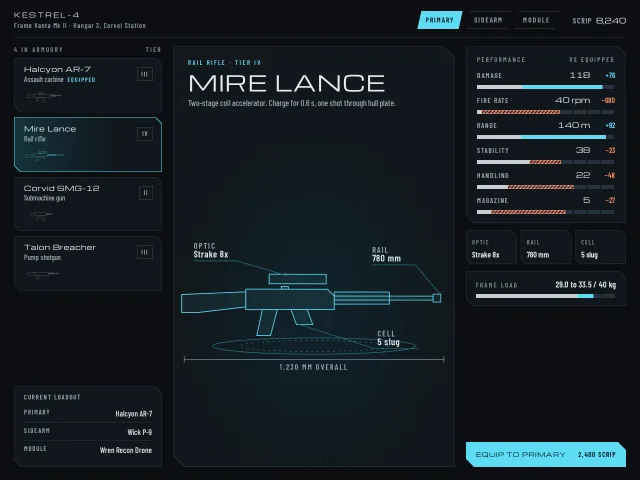
A sci-fi armoury: cut-corner panels, a weapon and module list, a hologram drawn in SVG that redraws on swap, and stat bars that show gains and losses.

Gacha pull reveal
A manga-styled summon on a phone: focus lines and a spinning seal charge up, a flash bursts, and a character card flips in lit by its rarity colour.
App icon spec sheet
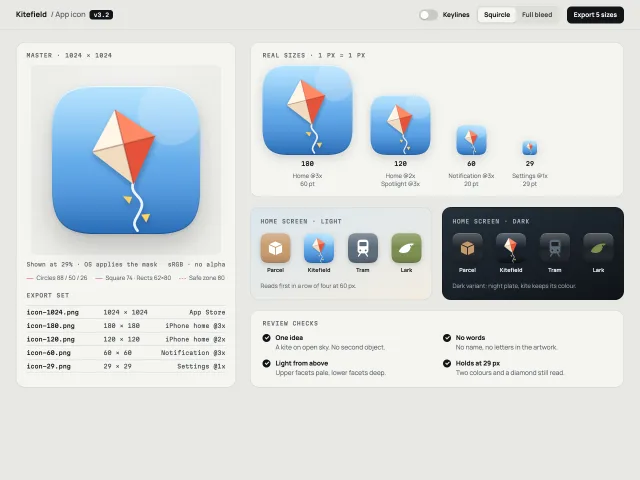
One app icon as a review page: a 1024 master with a keyline overlay and mask toggle, real-pixel sizes, light and dark home screens, and the export set.
Architecture studio index
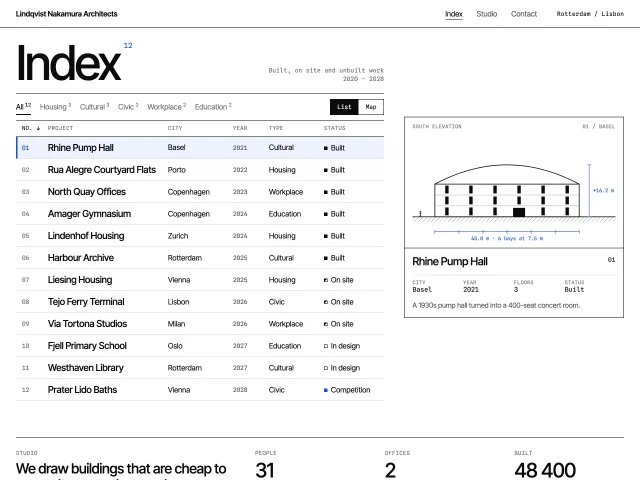
A Swiss studio index: sortable, filterable project table whose selected row drives a true-scale SVG elevation that slides to follow it, plus a map view.
Team members settings
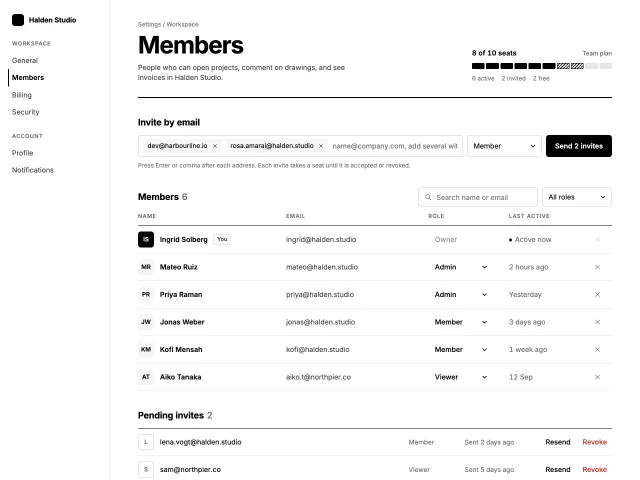
A Swiss members page: email chip invites, a seat meter, a table with inline role changes and an undo toast, pending invites, and a confirm before remove.
Roadmap swimlanes
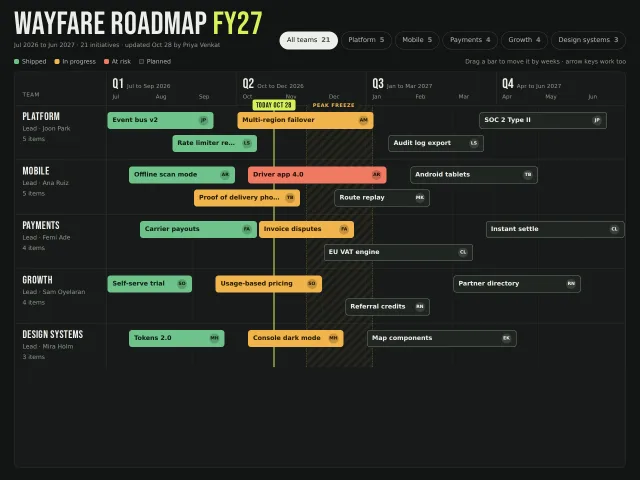
A dark product roadmap: four quarters across, team swimlanes down, status-coloured bars you drag along time by weeks, a today line, a freeze band and a team filter.